

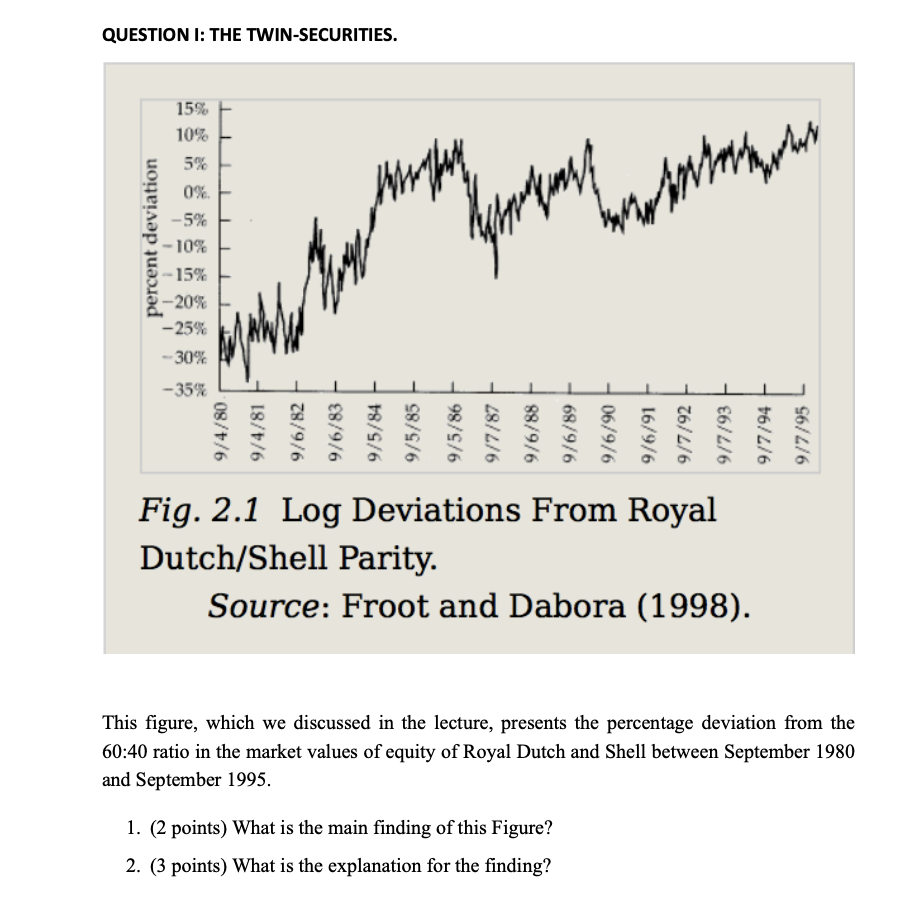
Question: This figure, which we discussed in the lecture, presents the percentage deviation from the 6 0 : 4 0 ratio in the market values of
This figure, which we discussed in the lecture, presents the percentage deviation from the :
ratio in the market values of equity of Royal Dutch and Shell between September and
September
points What is the main finding of this Figure?
points What is the explanation for the finding?
Step by Step Solution
There are 3 Steps involved in it
1 Expert Approved Answer
Step: 1 Unlock

Question Has Been Solved by an Expert!
Get step-by-step solutions from verified subject matter experts
Step: 2 Unlock
Step: 3 Unlock