

Question: this go with the previous question post: this is a better picture of the graph. evaluate reasons you believe deviations from parity with one of
evaluate reasons you believe deviations from parity with one of these two particular currency pairs are happening after 2013. A description of the path that these currencies have followed will not be sufficient. Think of it this way; the lines on the graph are indicating a response to a macro-economic event (or combinations of events). This is similar to a doctor evaluating an ECG (electrocardiogram) to determine issues with a patient's heart. He would use this to make a diagnosis of the patient's heart health.
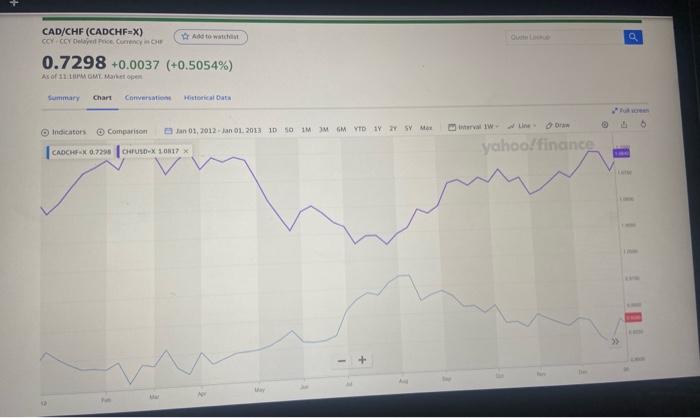
CAD/CHF (CADCHF=X) CCY CCP Curvey 0.7298 +0.0037 (+0.5054%) As of 11 M M M Summary Chart Conversation Hala valwatne Indicators Comparison Jan 01, 2012 jan 01. 2013 1D SO IMMYD1YISY Man CADCHP 0.729 Corso 4007 yahoo/finance
Step by Step Solution
There are 3 Steps involved in it

Get step-by-step solutions from verified subject matter experts