

Question: This graph and excel sheet shows the Canada's Current Account Balance, Total Investment and Gross National Savings all together. Interpret the graph according to theory
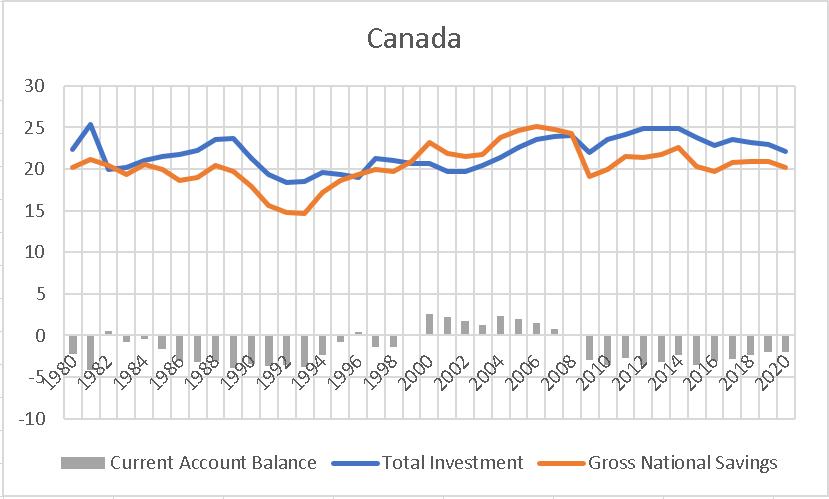
This graph and excel sheet shows the Canada's Current Account Balance, Total Investment and Gross National Savings all together. Interpret the graph according to theory about "saving investment relationship". If there is any structural change in time, search and find its reasons.
Please give a detailed explanation.
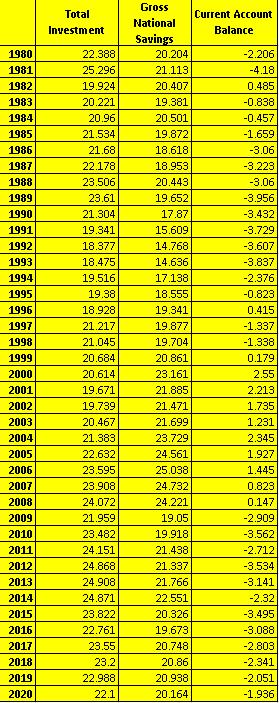
1980 1981 1982 1983 1984 1985 1986 1987 1988 1989 1990 1991 1992 1993 1994 1995 1996 1997 1998 1999 2000 2001 2002 2003 2004 2005 2006 2007 2008 2009 2010 2011 2012 2013 2014 2015 2016 2017 2018 2019 2020 Total Investment 22.388 25.296 19.924 20.221 20.96 21.534 21.68 22.178 23.506 23.61 21.304 19.341 18.377 18.475 19.516 19.38 18.928 21.217 21.045 20.684 20.614 19.671 19.739 20.467 21.383 22.632 23.595 23.908 24.072 21.959 23.482 24.151 24.868 24.908 24.871 23.822 22.761 23.55 23.2 22.988 22.1 Gross National Savings 20.204 21.113 20.407 19.381 20.501 19.872 18.618 18.953 20.443 19.652 17.87 15.609 14.768 14.636 17.138 18.555 19.341 19.877 19.704 20.861 23.161 21.885 21.471 21.699 23.729 24.561 25.038 24.732 24.221 19.05 19.918 21.438 21.337 21.766 22.551 20.326 19.673 20.748 20.86 20.938 20.164 Current Account Balance -2.206 -4.18 0.485 -0.838 -0.457 -1.659 -3.06 -3.223 -3.06 -3.956 -3.432 -3.729 -3.607 -3.837 -2.376 -0.823 0.415 -1.337 -1.338 0.179 2.55 2.213 1.735 1.231 2.345 1.927 1.445. 0.823 0.147 -2.909 -3.562 -2.712 -3.534 -3.141 -2.32 -3.495 -3.088 -2.803 -2.341 -2.051 -1.936
Step by Step Solution
3.37 Rating (144 Votes )
There are 3 Steps involved in it
Based on the given data and graphs its clear that we are looking at three key economic indicators for Canada Total Investment Gross National Savings a... View full answer

Get step-by-step solutions from verified subject matter experts