

Question: This graph and table each represent functions. g(x) -10 8 -6 4 -20 6 2.5 -2.75 -2.875 Which statements are accurate? Select all that apply.
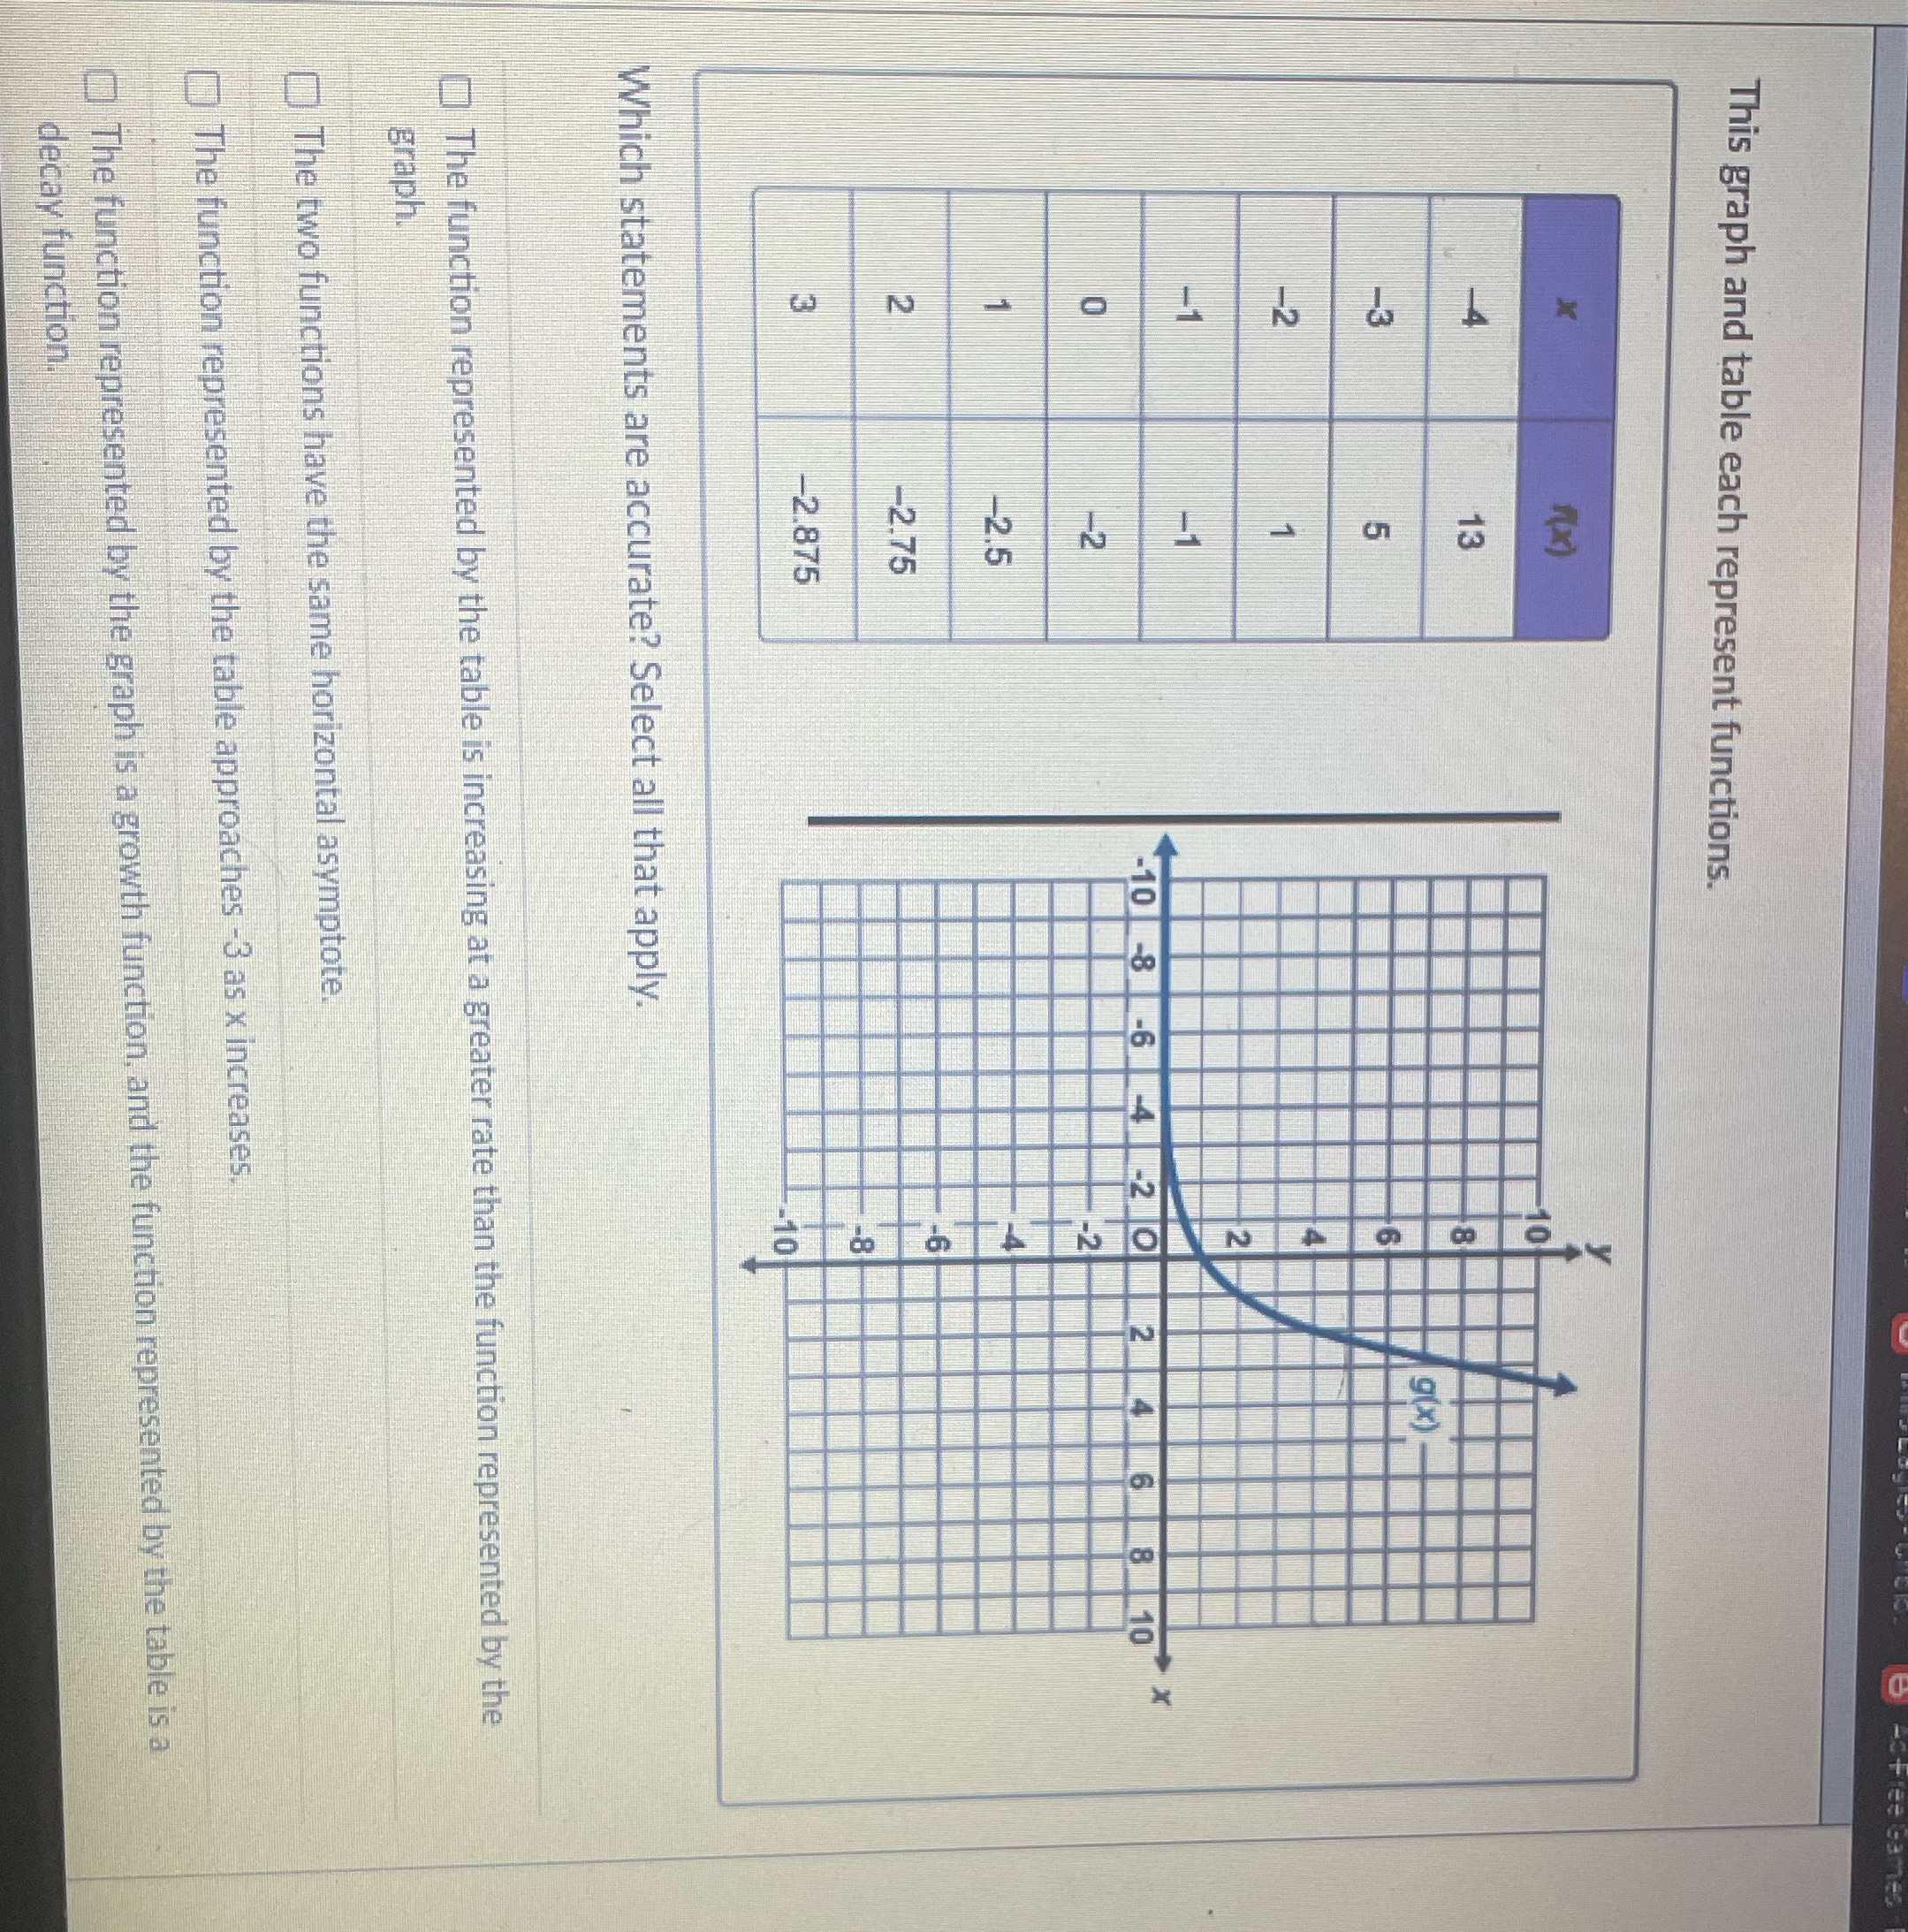
This graph and table each represent functions. g(x) -10 8 -6 4 -20 6 2.5 -2.75 -2.875 Which statements are accurate? Select all that apply. )The function represented by the table is increasing at a greater rate than the function represented by the graph. The two functions have the same horizontal asymptote. )The function represented by the table approaches -3 as x increases. The function represented by the graph is a growth function, and the function represented by the table is a decay function
Step by Step Solution
There are 3 Steps involved in it
1 Expert Approved Answer
Step: 1 Unlock

Question Has Been Solved by an Expert!
Get step-by-step solutions from verified subject matter experts
Step: 2 Unlock
Step: 3 Unlock