

Question: This Graph is GDP year 2006-2019.By using graph and information given , Dickey-Fuller unit-root test have 3 different types; no constant (for random walk process),
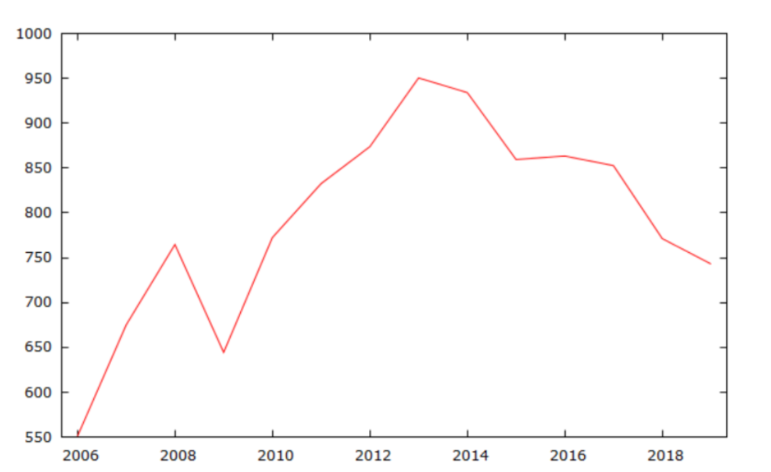
This Graph is GDP year 2006-2019.By using graph and information given , Dickey-Fuller unit-root test have 3 different types; no constant (for random walk process), constant (for random walk with drift process) and constant & trend.How do you decide which one of these three types to use? Please can you explain in details.
in 2006 = 550,8 , in 2007 = 675,01 , in 2008 = 764,64 , in 2009 = 644,47 , in 2010 = 772,29 , in 2011 = 832.5 , in 2012 = 873,7 , in 2013 = 950,33 , in 2014 =934,08 , in 2015 = 859,45 , in 2016 =863,39 , in 2017 = 852,65 , in 2018 =771,27 , in 2019 = 743,71
1000 950 | 900 850 | 800 750 700 | 650 600 550 2006 2008 2010 2012 2014 2016 2018 1000 950 | 900 850 | 800 750 700 | 650 600 550 2006 2008 2010 2012 2014 2016 2018
Step by Step Solution
There are 3 Steps involved in it

Get step-by-step solutions from verified subject matter experts