

Question: This graph shows changes in the boron doping concentration by silicon depth, Can you explain why boron doping concentration decreases largely at low temperatures and
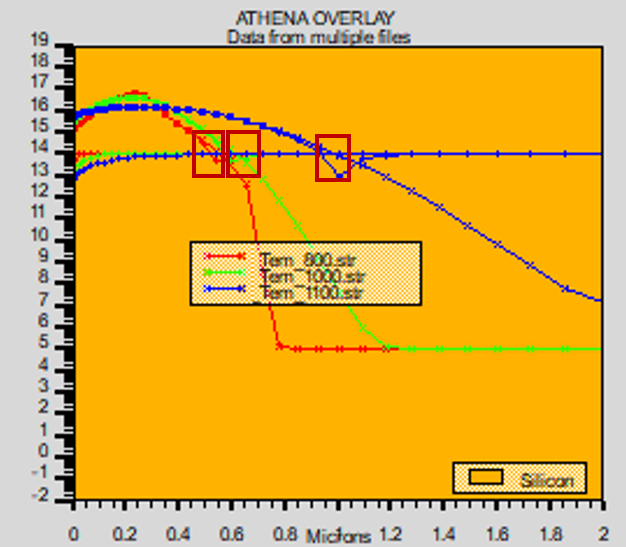
This graph shows changes in the boron doping concentration by silicon depth,
Can you explain why boron doping concentration decreases largely at low temperatures and is it related to net doping concentration ?
Step by Step Solution
There are 3 Steps involved in it
1 Expert Approved Answer
Step: 1 Unlock

Question Has Been Solved by an Expert!
Get step-by-step solutions from verified subject matter experts
Step: 2 Unlock
Step: 3 Unlock