

Question: This graph shows the comparison between age and alcohol involvement in car accidents. Accidents Histogram 181 Yes 12 Count AlcoholInvolvement 187 No 123 6 0

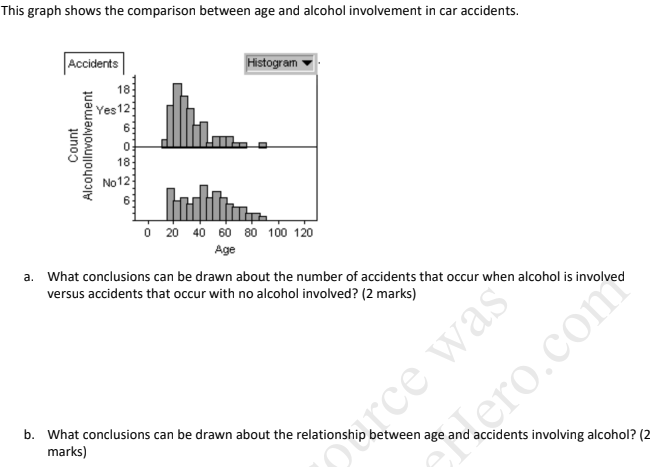
This graph shows the comparison between age and alcohol involvement in car accidents. Accidents Histogram 181 Yes 12 Count AlcoholInvolvement 187 No 123 6 0 20 40 60 80 100 120 Age a. What conclusions can be drawn about the number of accidents that occur when alcohol is involved versus accidents that occur with no alcohol involved? (2 marks) ce was ero.com b. What conclusions can be drawn about the relationship between age and accidents involving alcohol? (2 marks)
Step by Step Solution
There are 3 Steps involved in it
1 Expert Approved Answer
Step: 1 Unlock

Question Has Been Solved by an Expert!
Get step-by-step solutions from verified subject matter experts
Step: 2 Unlock
Step: 3 Unlock