

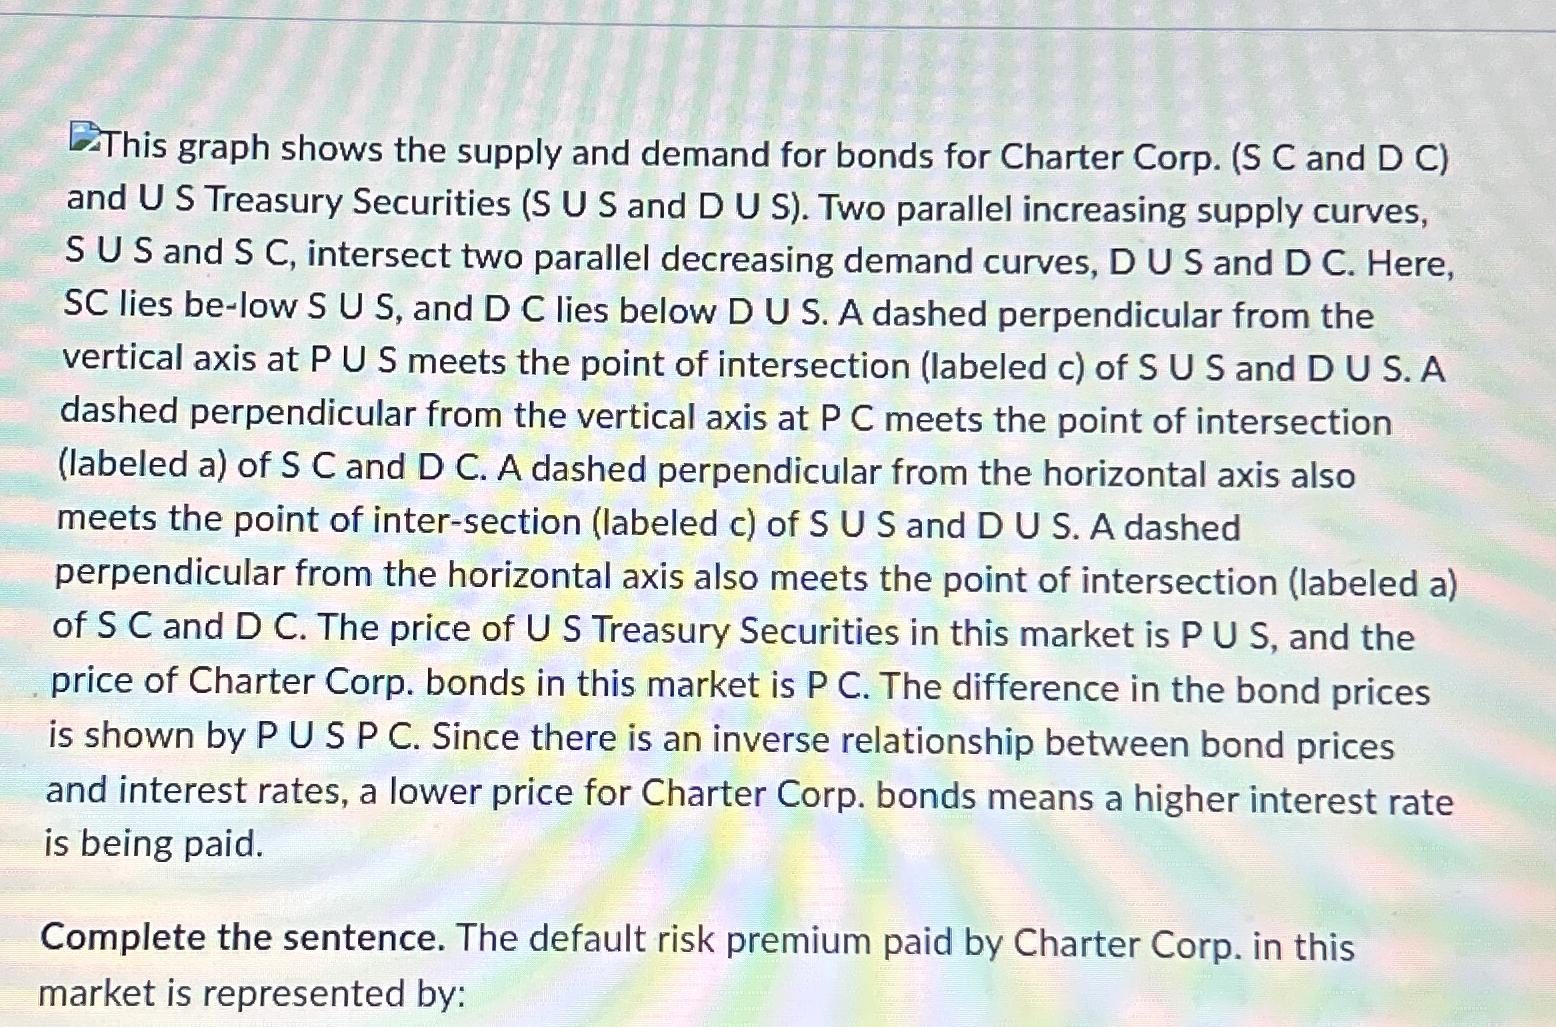
Question: This graph shows the supply and demand for bonds for Charter Corp. ( S C and D C ) and U S Treasury Securities (
This graph shows the supply and demand for bonds for Charter Corp. S C and D C and U S Treasury Securities S U S and D U S Two parallel increasing supply curves, S U S and S C intersect two parallel decreasing demand curves, D U S and D C Here, lies below and lies below D U S A dashed perpendicular from the vertical axis at P U S meets the point of intersection labeled c of S U S and D U SA dashed perpendicular from the vertical axis at meets the point of intersection labeled a of S C and D C A dashed perpendicular from the horizontal axis also meets the point of intersection labeled c of S U S and D U S A dashed perpendicular from the horizontal axis also meets the point of intersection labeled a of S C and D C The price of U S Treasury Securities in this market is PU S and the price of Charter Corp. bonds in this market is PC The difference in the bond prices is shown by PU S P C Since there is an inverse relationship between bond prices and interest rates, a lower price for Charter Corp. bonds means a higher interest rate is being paid.
Complete the sentence. The default risk premium paid by Charter Corp. in this market is represented by:
Step by Step Solution
There are 3 Steps involved in it
1 Expert Approved Answer
Step: 1 Unlock

Question Has Been Solved by an Expert!
Get step-by-step solutions from verified subject matter experts
Step: 2 Unlock
Step: 3 Unlock