

Question: THIS HAS TO BE DONE IN R & RSTUDIO PROGRAMMING LANGUAGE!! AND CODES AS ANSWERS NEEDED. Problem 2: The data file Gas_2019.xlsx shows the average
THIS HAS TO BE DONE IN R & RSTUDIO PROGRAMMING LANGUAGE!! AND CODES AS ANSWERS NEEDED.
Problem 2: The data file Gas_2019.xlsx shows the average price of gas (Price in $per gallon) for the 50 states during January 2019.
a) Construct a boxplot for the Price variable. Comment on the symmetry of the distribution. Does the boxplot suggest that outliers exist?
b) Compute the mean and standard deviation of this Price variable. Order your Price data column to find the maximum and minimum value for the price variable. Calculate z-scores (Z-score = (X Mean)/S.D.) on the largest and smallest value to determine if there are any outliers for the Price variable. Remember z-scores are reliable indicators of outliers when the distribution is relatively symmetric.
Are your results consistent with part a) above? Elaborate on possible reasons of why so?
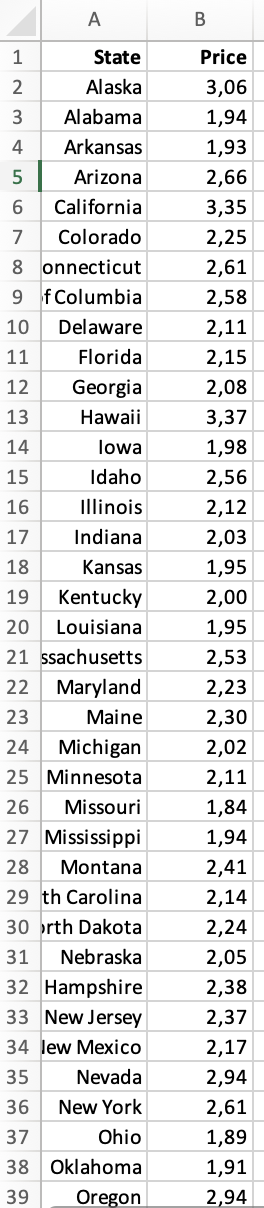
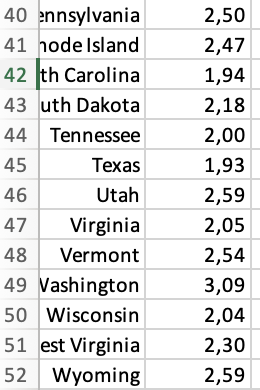
\begin{tabular}{|r|r|r|} \hline & A & \multicolumn{1}{|c|}{ B } \\ \hline 1 & State & Price \\ \hline 2 & Alaska & 3,06 \\ \hline 3 & Alabama & 1,94 \\ \hline 4 & Arkansas & 1,93 \\ \hline 5 & Arizona & 2,66 \\ \hline 6 & California & 3,35 \\ \hline 7 & Colorado & 2,25 \\ \hline 8 & onnecticut & 2,61 \\ \hline 9 & f Columbia & 2,58 \\ \hline 10 & Delaware & 2,11 \\ \hline 11 & Florida & 2,15 \\ \hline 12 & Georgia & 2,08 \\ \hline 13 & Hawaii & 3,37 \\ \hline 14 & lowa & 1,98 \\ \hline 15 & Idaho & 2,56 \\ \hline 16 & Illinois & 2,12 \\ \hline 17 & Indiana & 2,03 \\ \hline 18 & Kansas & 1,95 \\ \hline 19 & Kentucky & 2,00 \\ \hline 20 & Louisiana & 1,95 \\ \hline 21 & ssachusetts & 2,53 \\ \hline 22 & Maryland & 2,23 \\ \hline 23 & Maine & 2,30 \\ \hline 24 & Michigan & 2,02 \\ \hline 25 & Minnesota & 2,11 \\ \hline 26 & Missouri & 1,84 \\ \hline 27 & Mississippi & 1,94 \\ \hline 28 & Montana & 2,41 \\ \hline 29 & th Carolina & 2,14 \\ \hline 30 & rtth Dakota & 2,24 \\ \hline 31 & Nebraska & 2,05 \\ \hline 32 & Hampshire & 2,38 \\ \hline 33 & New Jersey & 2,37 \\ \hline lew Mexico & 2,17 \\ \hline 35 & Nevada & 2,94 \\ \hline 17 & 2,94 \\ \hline \end{tabular} \begin{tabular}{|r|r|r|} \hline 40 & ennsylvania & 2,50 \\ \hline 41 & lode Island & 2,47 \\ \hline 42 & th Carolina & 1,94 \\ \hline 43 & uth Dakota & 2,18 \\ \hline 44 & Tennessee & 2,00 \\ \hline 45 & Texas & 1,93 \\ \hline 46 & Utah & 2,59 \\ \hline 47 & Virginia & 2,05 \\ \hline 48 & Vermont & 2,54 \\ \hline 49 & Vashington & 3,09 \\ \hline 50 & Wisconsin & 2,04 \\ \hline 51 & est Virginia & 2,30 \\ \hline 52 & Wyoming & 2,59 \\ \hline \end{tabular}
Step by Step Solution
There are 3 Steps involved in it

Get step-by-step solutions from verified subject matter experts