

Question: - This homework should include a table of metrics calculated & a response to 2 questions: - 1. Calculate and compare the financial metrics (the
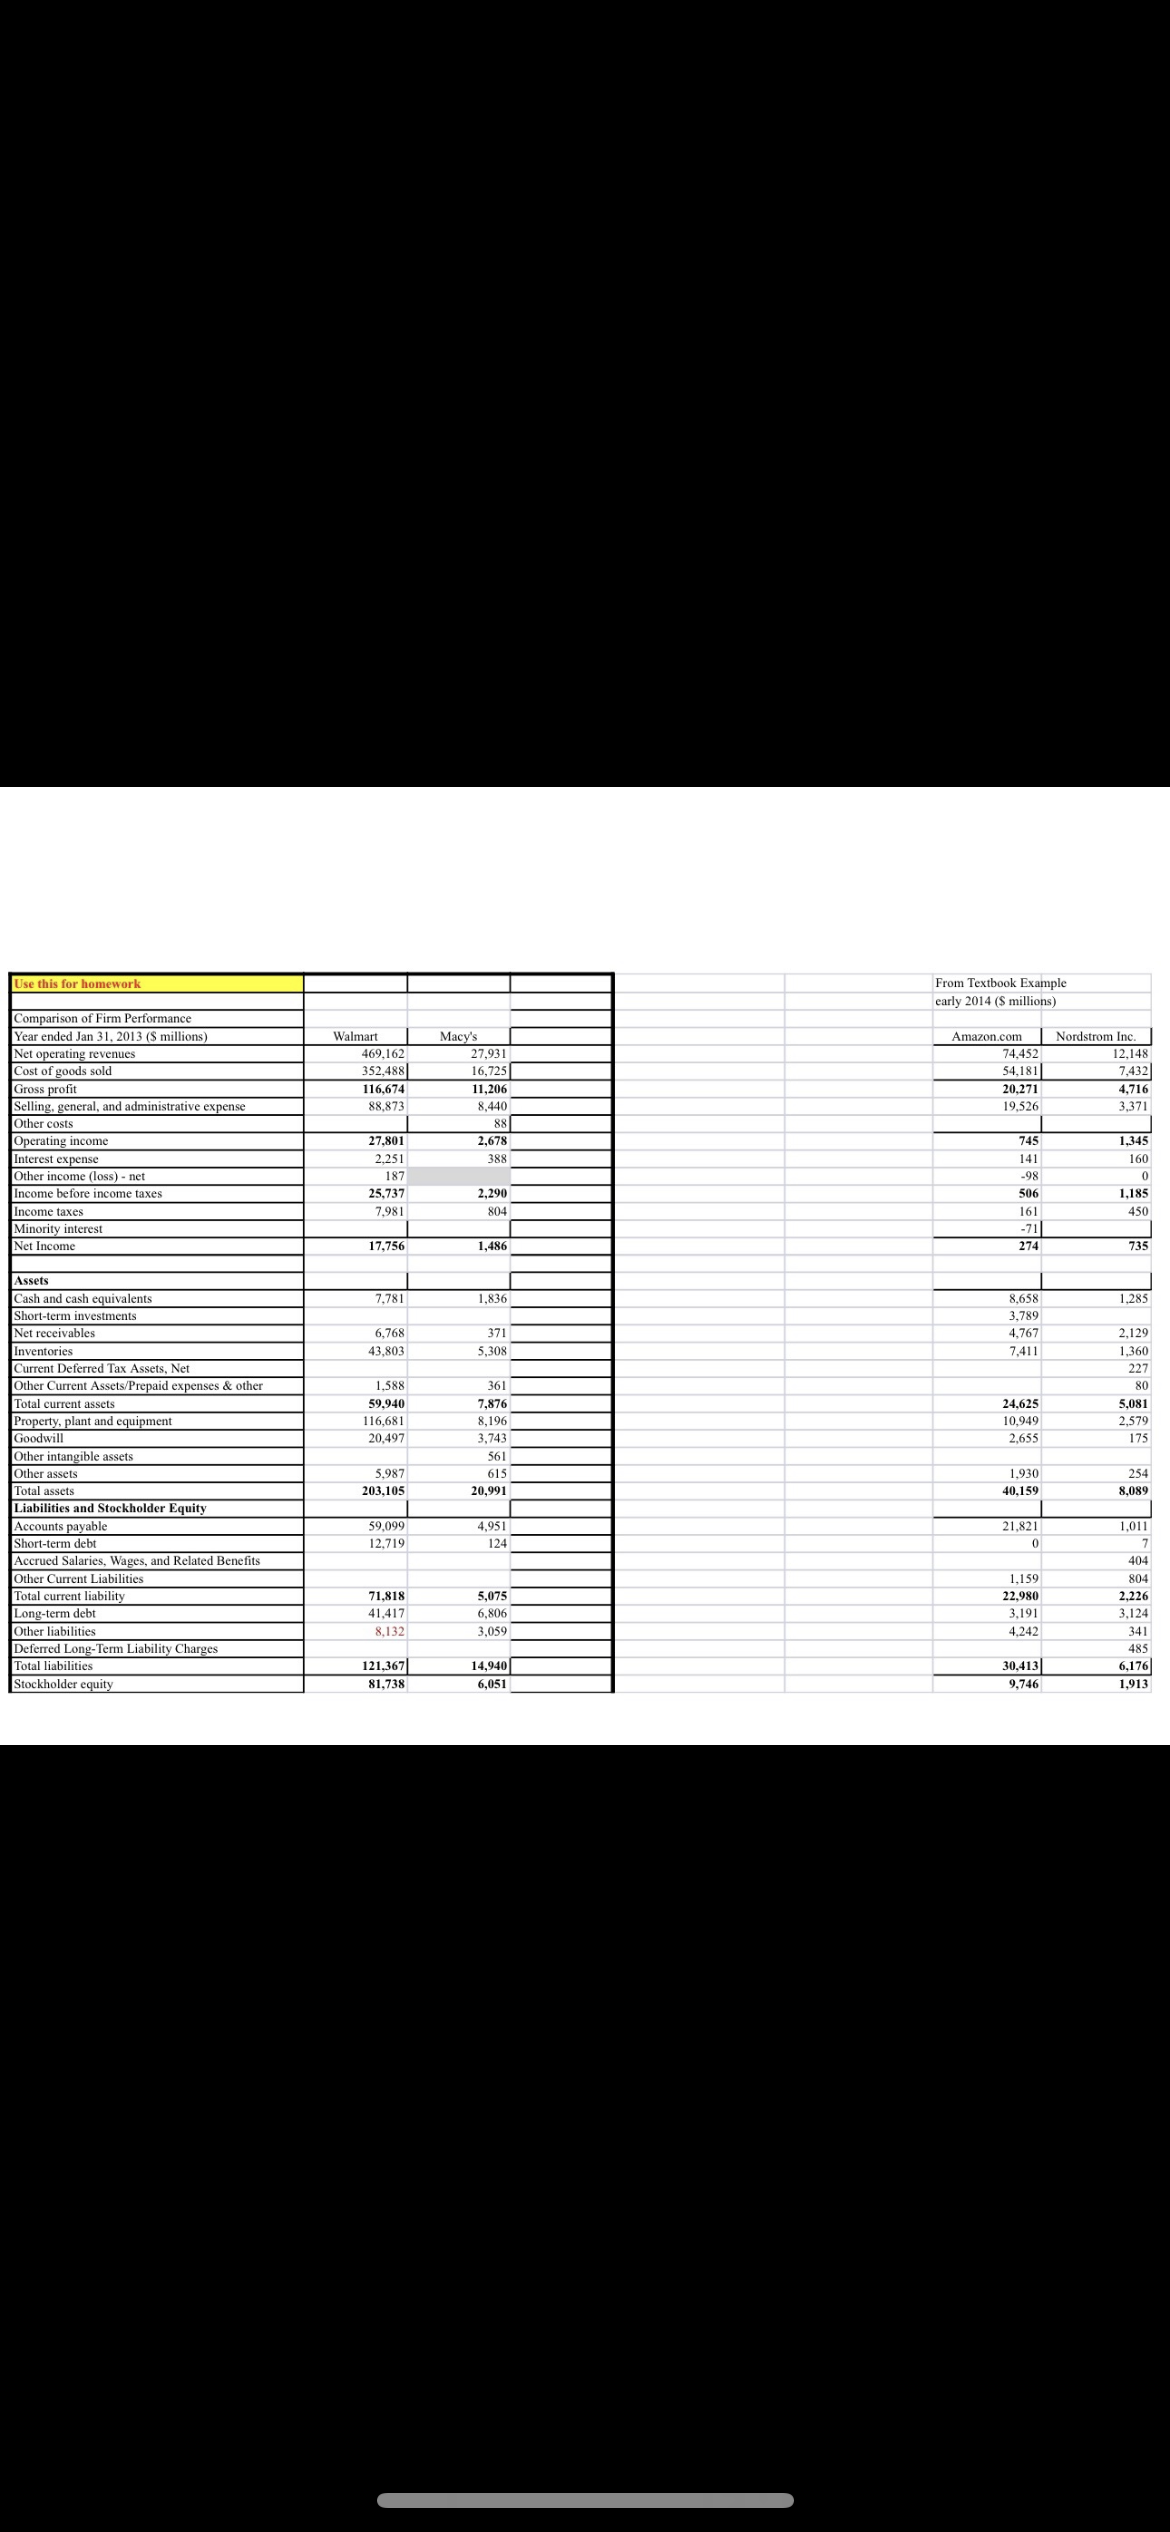
- This homework should include a table of metrics calculated \& a response to 2 questions: - 1. Calculate and compare the financial metrics (the types of metrics in Table 3-2) of Walmart, \& Macy's. (For each metric, note which company performs best and which has the lowest performance.) - 2. Provide possible explanations for a performance difference you noted for any two of the metrics. (You may draw on information from their financial statements - and any info in chapters 2 or 3 about their demand and supply uncertainty, supply chain capabilities/responsiveness, or supply chain levers or drivers.) - Use the financial data in the spreadsheet (on Canvas) Walmart and Macy Financials, not the data on page 68. (Textbook has a couple of incorrect numbers.). - This homework should include a table of metrics calculated \& a response to 2 questions: - 1. Calculate and compare the financial metrics (the types of metrics in Table 3-2) of Walmart, \& Macy's. (For each metric, note which company performs best and which has the lowest performance.) - 2. Provide possible explanations for a performance difference you noted for any two of the metrics. (You may draw on information from their financial statements - and any info in chapters 2 or 3 about their demand and supply uncertainty, supply chain capabilities/responsiveness, or supply chain levers or drivers.) - Use the financial data in the spreadsheet (on Canvas) Walmart and Macy Financials, not the data on page 68. (Textbook has a couple of incorrect numbers.)
Step by Step Solution
There are 3 Steps involved in it

Get step-by-step solutions from verified subject matter experts