

Question: This I SAS program code quiestions Question 1 use all SAS program/code under GRADE under Question 1 in order to answer the following questions. It

This I SAS program code quiestions
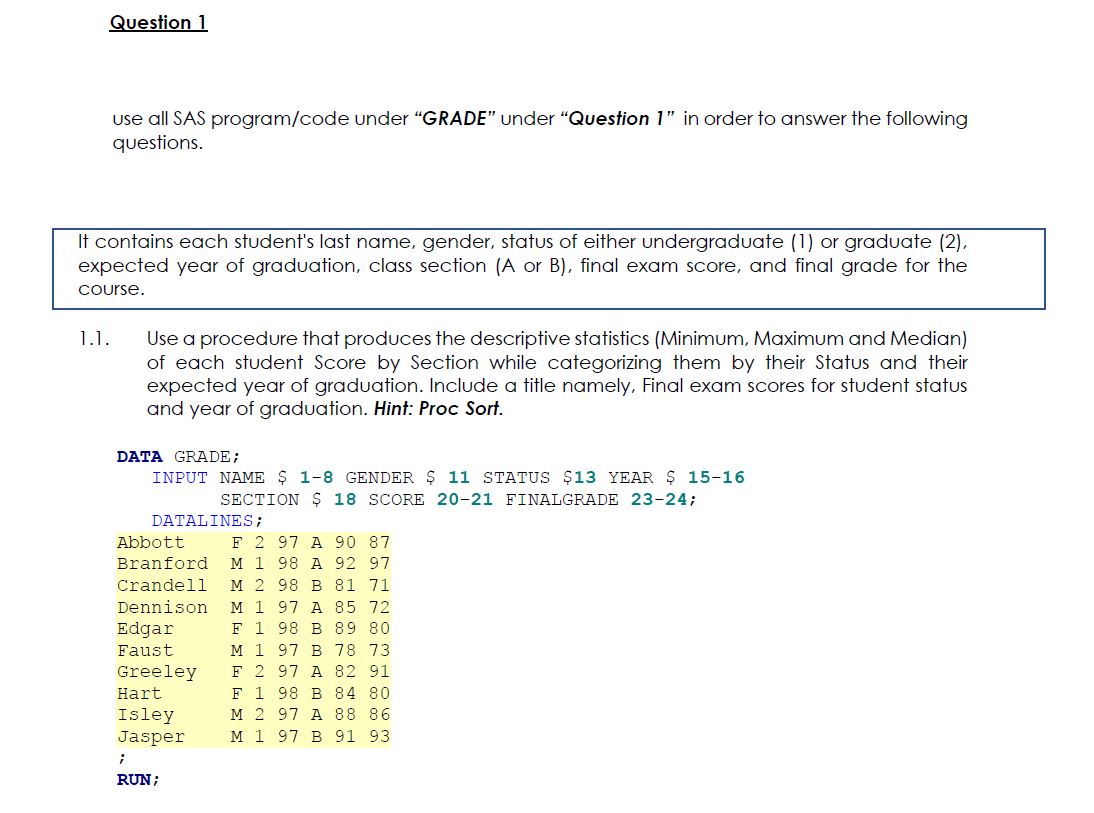
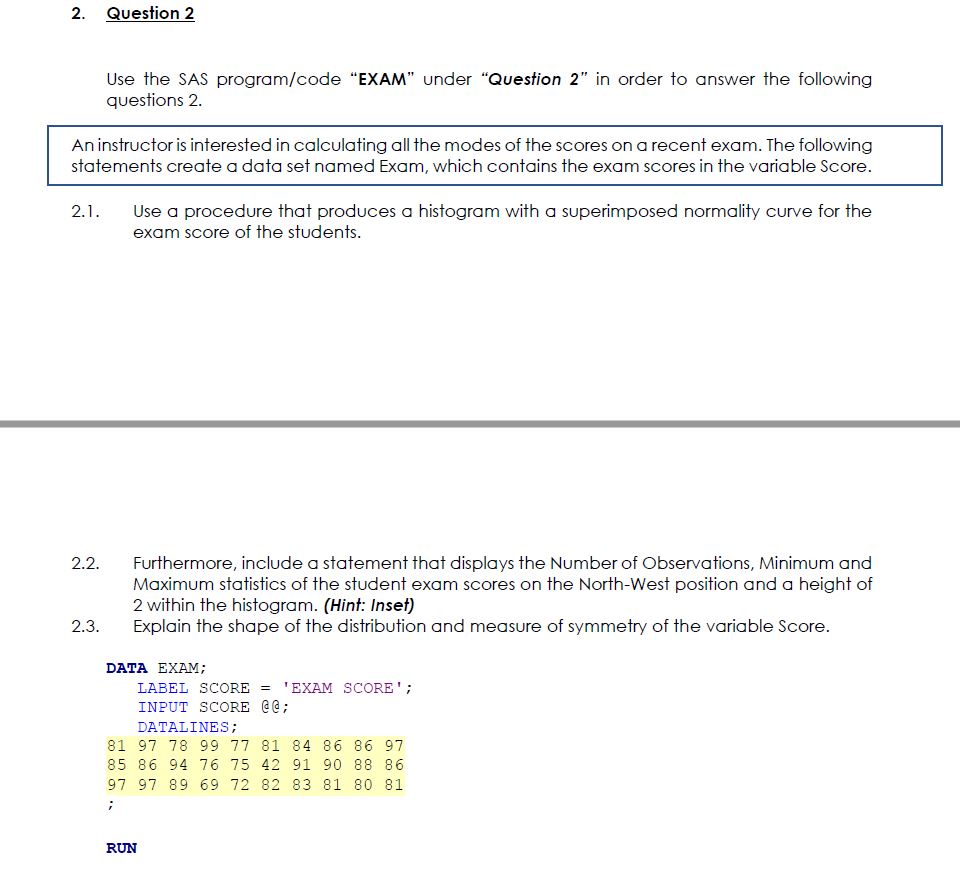
Question 1 use all SAS program/code under "GRADE" under "Question 1" in order to answer the following questions. It contains each student's last name, gender, status of either undergraduate (1) or graduate (2), expected year of graduation, class section (A or B), final exam score, and final grade for the course. 1.1. Use a procedure that produces the descriptive statistics (Minimum, Maximum and Median) of each student Score by Section while categorizing them by their Status and their expected year of graduation. Include a title namely, Final exam scores for student status and year of graduation. Hint: Proc Sort. DATA GRADE; INPUT NAME $ 1-8 GENDER $ 11 STATUS $13 YEAR $ 15-16 SECTION $ 18 SCORE 20-21 FINALGRADE 23-24; DATALINES ; Abbott F 2 97 A 90 87 Branford M 1 98 A 92 97 Crandell M 2 98 B 81 71 Dennison M 1 97 A 85 72 Edgar F 1 98 B 89 80 Faust M 1 97 B 78 73 Greeley F 2 97 A 82 91 Hart F 1 98 B 84 80 Isley M 2 97 A 88 86 Jasper M 1 97 B 91 93 RUN ;2. Question 2 Use the SAS programfcode "EXAM" under "Question 2" in order to answer the following questions 2. 2.1. Use a procedure that produces a histogram with a superimposed normality curve for the exam score of the students. 2.2. Furthermore, include a statement that displays the Number of Observations, Minimum and Maximum statistics of the student exam scores on the NorthWest position and a height of 2 within the histogram. (Hint: inset) 2.3. Explain the shape of the distribution and measure of symmetry of the variable Score. DATA EXAM; LABEL SCORE = 'EXAM SCORE': INPUT SCORE @6; DATALINES; 31 9? TB 99 T? 81 84 86 86 97 35 86 94 T6 T5 42 91 90 88 86 9? 97 89 69 T2 32 33 81 80 81 r BUN
Step by Step Solution
There are 3 Steps involved in it

Get step-by-step solutions from verified subject matter experts