

Question: This is a 5, 10, and 30-minute line chart for futures trading. Please analyze its shape and movement through technical analysis. 42 2021/10/01-15:857 +390,00 385.00
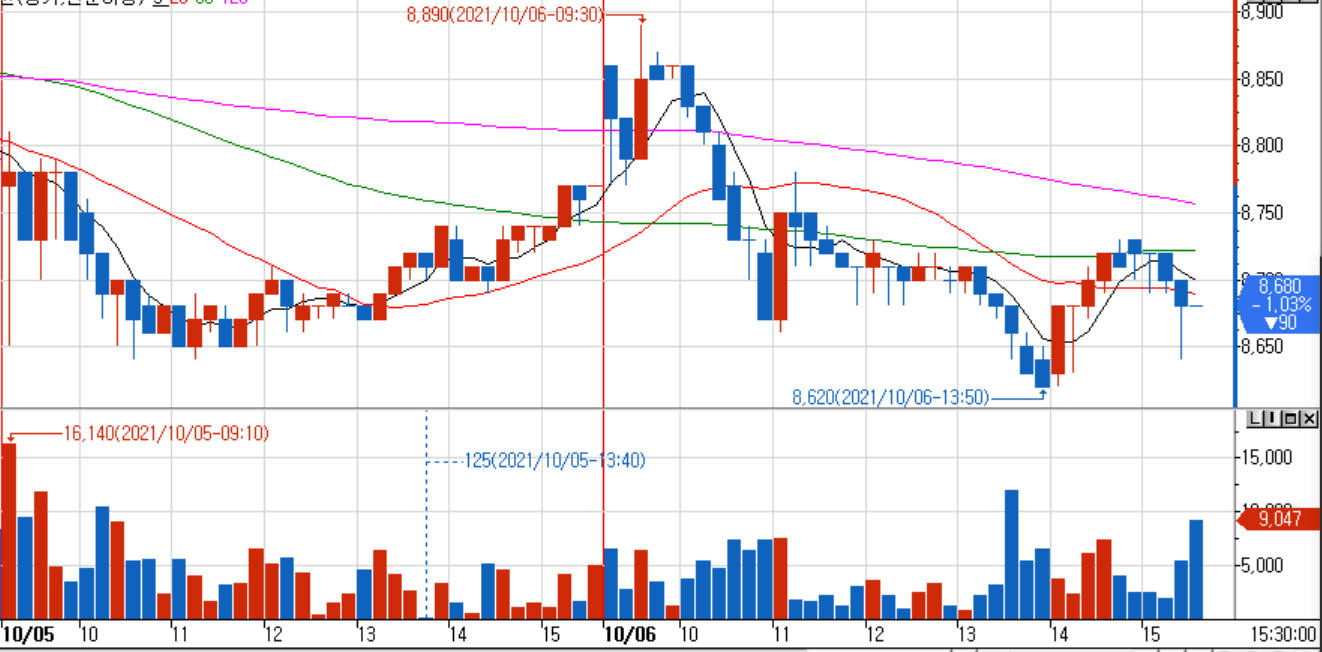
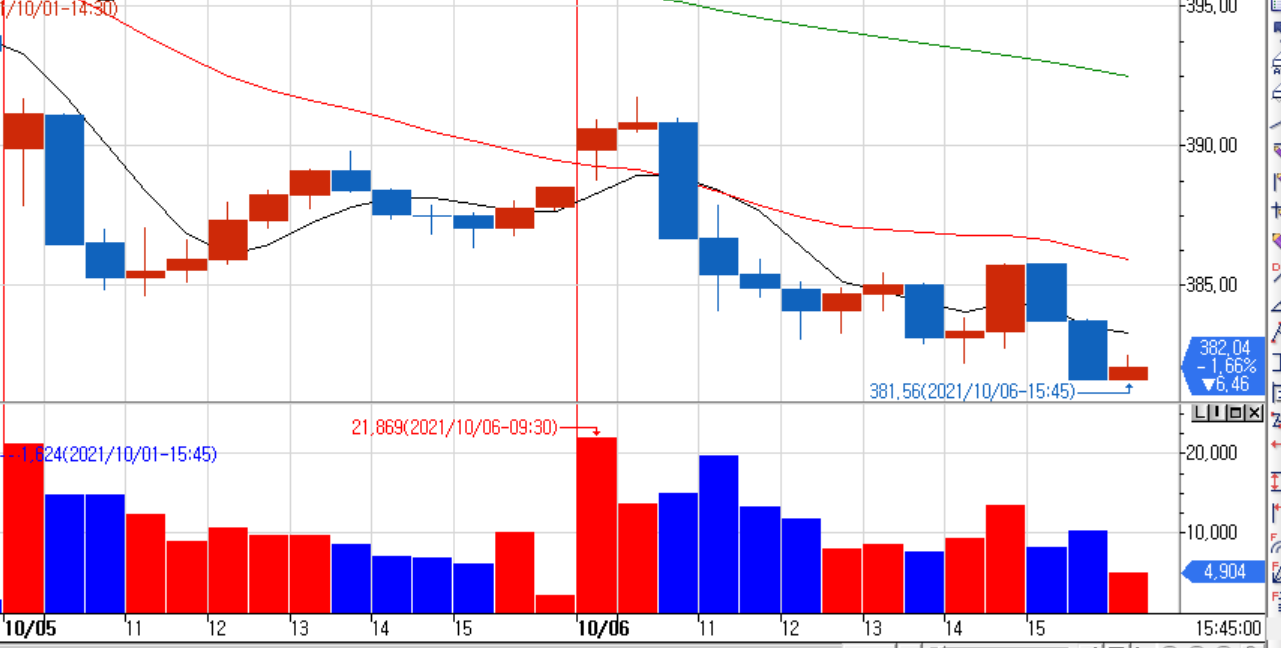
This is a 5, 10, and 30-minute line chart for futures trading. Please analyze its shape and movement through technical analysis.
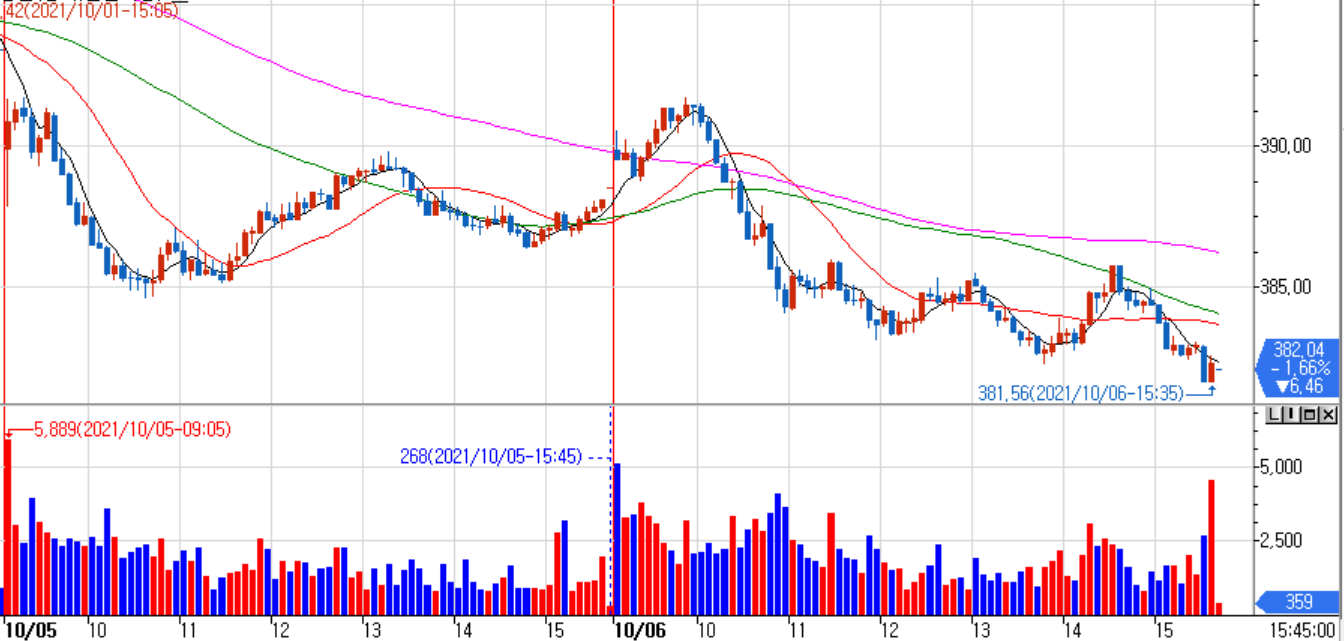
42 2021/10/01-15:857 +390,00 385.00 382,04 -1.66% 76.46 LUOX 381,56(2021/10/06-15:35) -5,889(2021/10/05-09:05) 268(2021/10/05-15:45) -5,000 +2.500 359 15:45:00 10/05 10 11 '12 '13 14 '15 10/06 '10 '11 12 13 '14 '15 8,890(2021/10/06-09:30) 8.900 8.850 8,800 18,750 8,680 -1.03% 790 8,650 8,620(2021/10/06-13:50) LUOX -16.140(2021/10/05-09:10) --125(2021/10/05-13:40) -15,000 9.047 -5,000 NULL '10/05 10 11 12 13 '14 '15 10/06 10 '11 12 13 '14 '15 15:30:00 110/01-14.30 F395,00 390,00 + +385,00 381,56(2021/10/06-15:45)- 382,04 - 1.66% V6.46 LOOX 21,869(2021/10/06-09:30) -1.824(2021/10/01-15:45) +20,000 -10,000 4,904 F 10/05 '12 13 '14 15 10/06 (11 12 13 14 15 15:45:00
Step by Step Solution
There are 3 Steps involved in it

Get step-by-step solutions from verified subject matter experts