

Question: This is a bus 173 question please solve Q1 &Q2 8:47 0 E 2': :'A I, 6 Document View Answer all the questions. You must

This is a bus 173 question please solve Q1 &Q2
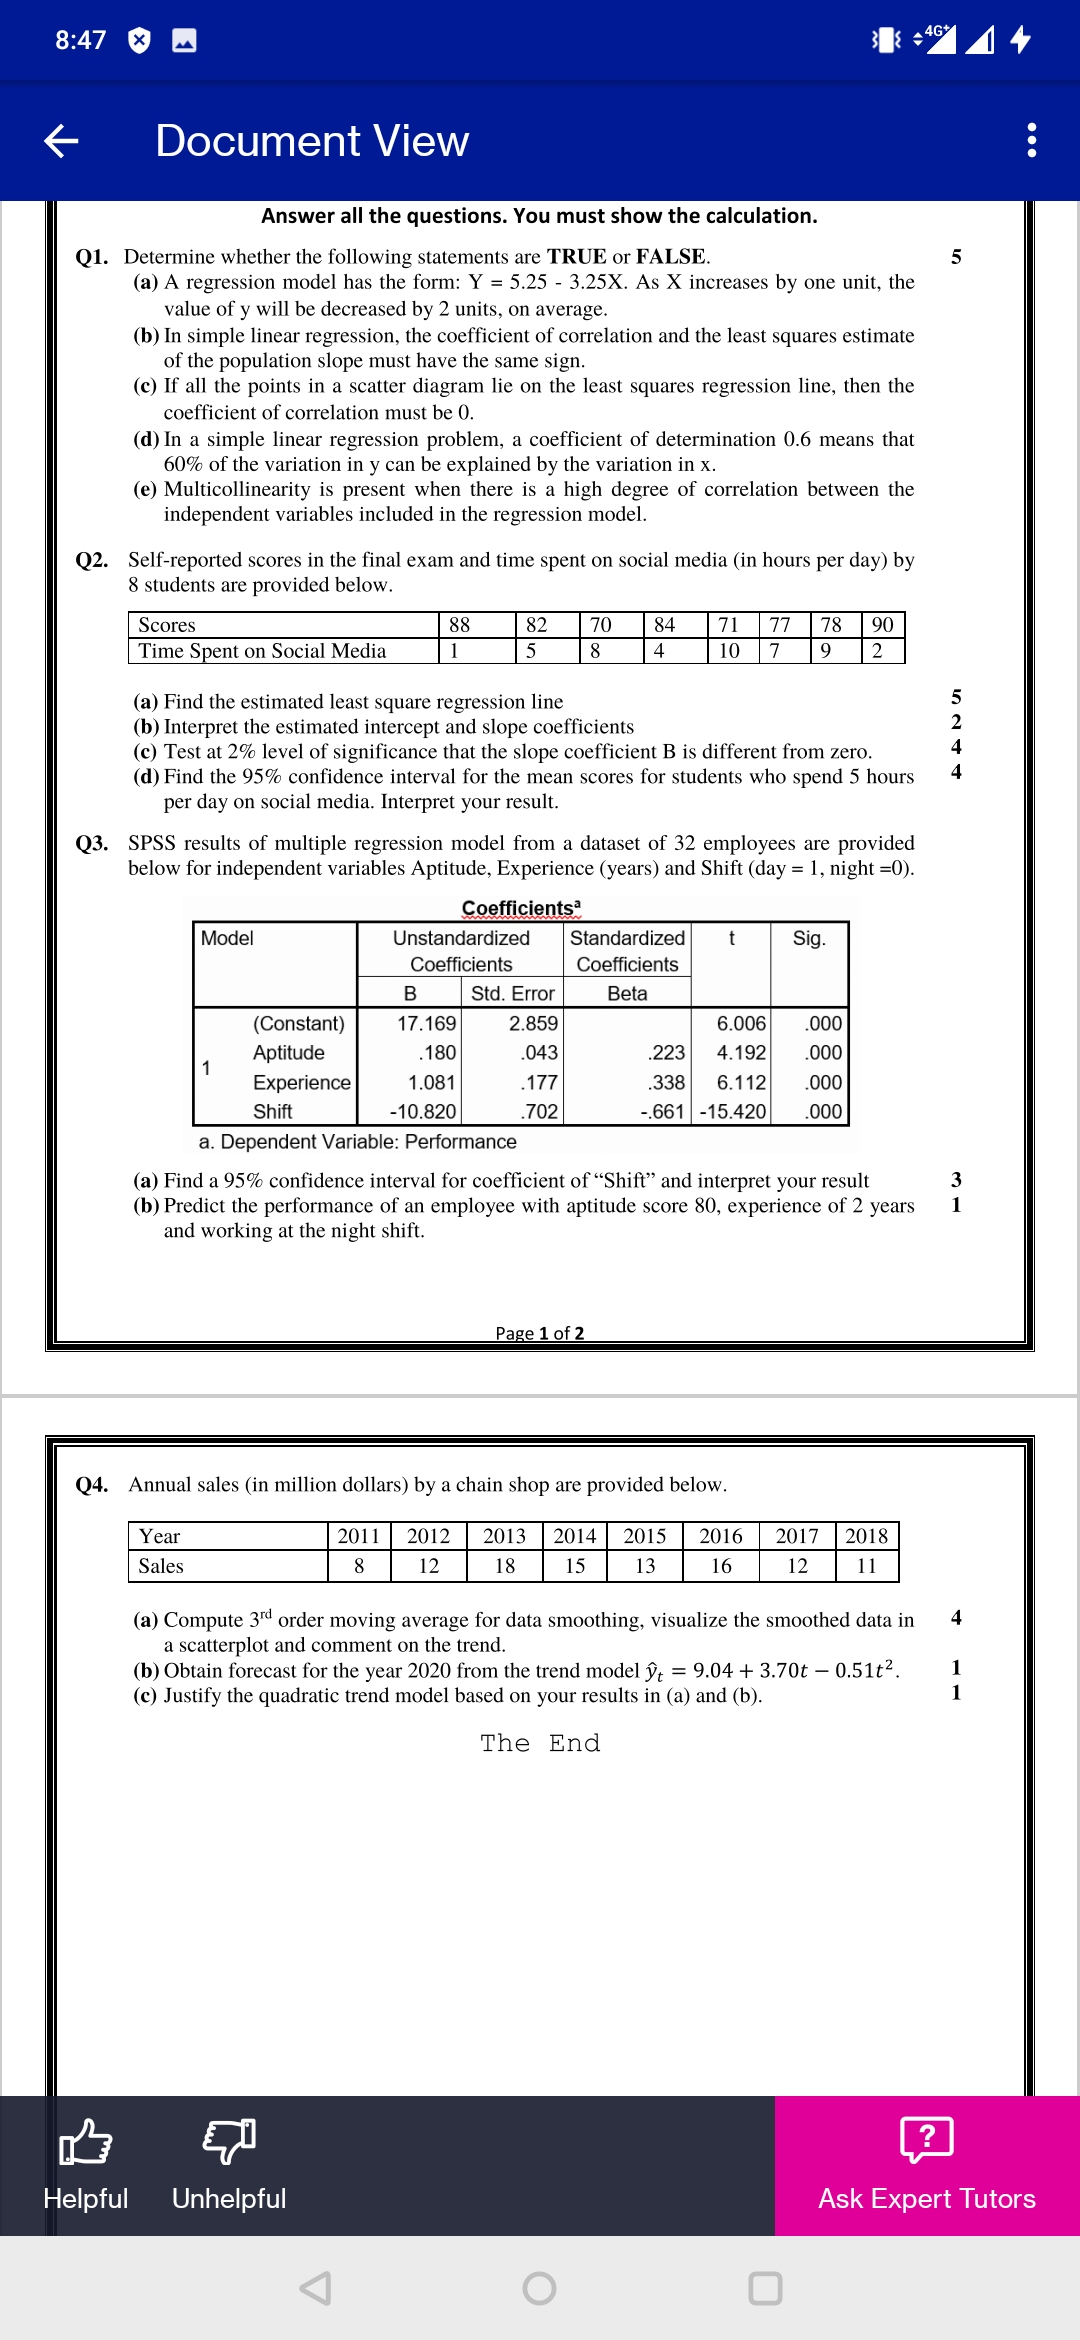
8:47 0 E 2': :'A I, 6 Document View Answer all the questions. You must show the calculation. Q1. Determine whether the following statements are TRUE or FALSE. (a) A regression model has the form: Y = 5.25 - 3.25X. As X increases by one unit, the value of y will be decreased by 2 units, on average. (b) In simple linear regression, the coefcient of correlation and the least squares estimate of the population slope must have the same sign. (c) If all the points in a scatter diagram lie on the least squares regression line, then the coefficient of correlation must be 0, (d) In a simple linear regression problem, a coefficient of deterrrrination 0.6 means that 60% of the variation in y can be explained by the variation in it. (e) Multicollinearity is present when there is a high degree of correlation between the independent variables included in the regression model. Self-reported scores in the final exam and time spent on social media (in hours per day) by 8 students are provided below. Time Spent on Social Media (a) Find the estimated least square regression line (b) Interpret the estimated intercept and slope coefficients (c) Test at 2% level of significance that the slope coefficient B is different from zero, (11) Find the 95% confidence interval for the mean scores for students who spend 5 hours per day on social media. Interpret your result. SPSS results of multiple regression model from a damset of 32 employees are provided below for independent variables Aptitude, Experience (years) and Shift (day = 1, night :0), Qgslglenis. Unstandardized Standardized \"- \"- (Constant) Aptitude Experience . . Shi . .661 -15.420 a. Dependent Variable: Performance (a) Find a 95% condence interval for coefcient of \"Shift\" and interpret your result 3 (b) Predict the performance of an employee with aptitude score 80, experience of 2 years 1 and working at the night shift. Page 1 of 2 Q4. Annual sales (in million dollars) by a chain shop are provided below. (a) Compute 3rd order moving average for data smoothing, visualize the smoothed data in a scatterplot and comment on the trend. (b) Obtain forecast for the year 2020 from the trend model it = 9.04 + 3.70t 0.51t2. (c) Justify the quadratic trend model based on your results in (a) and (b). The End 1135513 El Helpful Unhelpful Ask Expert Tutors
Step by Step Solution
There are 3 Steps involved in it

Get step-by-step solutions from verified subject matter experts