

Question: this is a conceptual question, no calculation is needed 8. Berkshire Hathaway is a publicly traded conglomerate that frequently engages in acquisitions and direct investments
this is a conceptual question, no calculation is needed
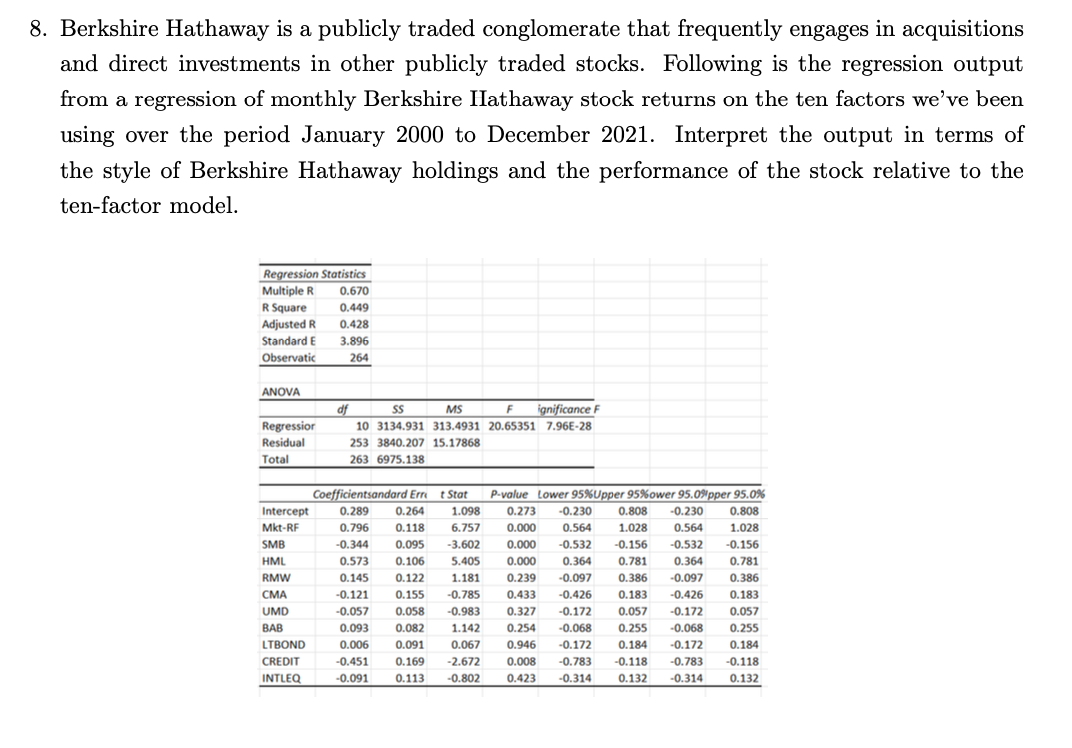
8. Berkshire Hathaway is a publicly traded conglomerate that frequently engages in acquisitions and direct investments in other publicly traded stocks. Following is the regression output from a regression of monthly Berkshire IIathaway stock returns on the ten factors we've been using over the period January 2000 to December 2021. Interpret the output in terms of the style of Berkshire Hathaway holdings and the performance of the stock relative to the ten-factor model. Regression Statistics Multiple R 0.670 R Square 0.449 Adjusted R 0.428 Standard E 3.896 Observatic 264 ANOVA Regressior Residual df SS MS F ignificance F 10 3134.931 313.4931 20.65351 7.96E-28 253 3840.207 15.17868 263 6975.138 Total Coefficientsandard Ernt Stat Intercept 0.289 0.264 1.098 Mkt-RF - 0.796 0.118 6.757 SMB -0.344 0.095 -3.602 HML 0.573 0.106 5.405 RMW 0.145 0.122 1.181 -0.121 0.155 -0.785 UMD -0.057 0.058 -0.983 BAB 0.093 0.082 1.142 LTBOND 0.006 0.091 0.067 -0.451 0.169 -2.672 INTLEQ -0.091 0.113 -0.802 MT P-value Lower 95%Upper 95%ower 95.0%pper 95.0% 0.273 -0.230 0.808 -0.230 0.808 0.000 0.564 1.028 0.564 1.028 0.000 -0.532 -0.156 -0.532 -0.156 0.000 0.364 0.781 0.364 0.781 0.239 -0.097 0.386 -0.097 0.386 0.433 -0.426 0.183 -0.426 0.183 0.327 -0.172 0.057 -0.172 0.057 0.254 -0.068 -0.068 0.255 0.946 -0.172 0.184 -0.172 0.184 0.008 -0.783 -0.118 -0.783 -0.118 0.423 -0.314 0.132 -0.314 0.132 0.255 CREDIT 8. Berkshire Hathaway is a publicly traded conglomerate that frequently engages in acquisitions and direct investments in other publicly traded stocks. Following is the regression output from a regression of monthly Berkshire IIathaway stock returns on the ten factors we've been using over the period January 2000 to December 2021. Interpret the output in terms of the style of Berkshire Hathaway holdings and the performance of the stock relative to the ten-factor model. Regression Statistics Multiple R 0.670 R Square 0.449 Adjusted R 0.428 Standard E 3.896 Observatic 264 ANOVA Regressior Residual df SS MS F ignificance F 10 3134.931 313.4931 20.65351 7.96E-28 253 3840.207 15.17868 263 6975.138 Total Coefficientsandard Ernt Stat Intercept 0.289 0.264 1.098 Mkt-RF - 0.796 0.118 6.757 SMB -0.344 0.095 -3.602 HML 0.573 0.106 5.405 RMW 0.145 0.122 1.181 -0.121 0.155 -0.785 UMD -0.057 0.058 -0.983 BAB 0.093 0.082 1.142 LTBOND 0.006 0.091 0.067 -0.451 0.169 -2.672 INTLEQ -0.091 0.113 -0.802 MT P-value Lower 95%Upper 95%ower 95.0%pper 95.0% 0.273 -0.230 0.808 -0.230 0.808 0.000 0.564 1.028 0.564 1.028 0.000 -0.532 -0.156 -0.532 -0.156 0.000 0.364 0.781 0.364 0.781 0.239 -0.097 0.386 -0.097 0.386 0.433 -0.426 0.183 -0.426 0.183 0.327 -0.172 0.057 -0.172 0.057 0.254 -0.068 -0.068 0.255 0.946 -0.172 0.184 -0.172 0.184 0.008 -0.783 -0.118 -0.783 -0.118 0.423 -0.314 0.132 -0.314 0.132 0.255 CREDIT
Step by Step Solution
There are 3 Steps involved in it

Get step-by-step solutions from verified subject matter experts