

Question: This is a data resource presented by News 24 on the tracking of the number of learners who wrote matric in 2022. The datastarts in
This is a data resource presented by News 24 on the tracking of the number of learners who wrote matric in 2022. The datastarts in Grade 1 of 2011 and gives the number of learners who were at school in each grade throughout the years. Pleasenote the following: In South Africa, Grade 9 is still considered an exit-year for those who want to enter the work force; andthe FET phase (Further Education and Training) is Grade 10 to Grade 12.
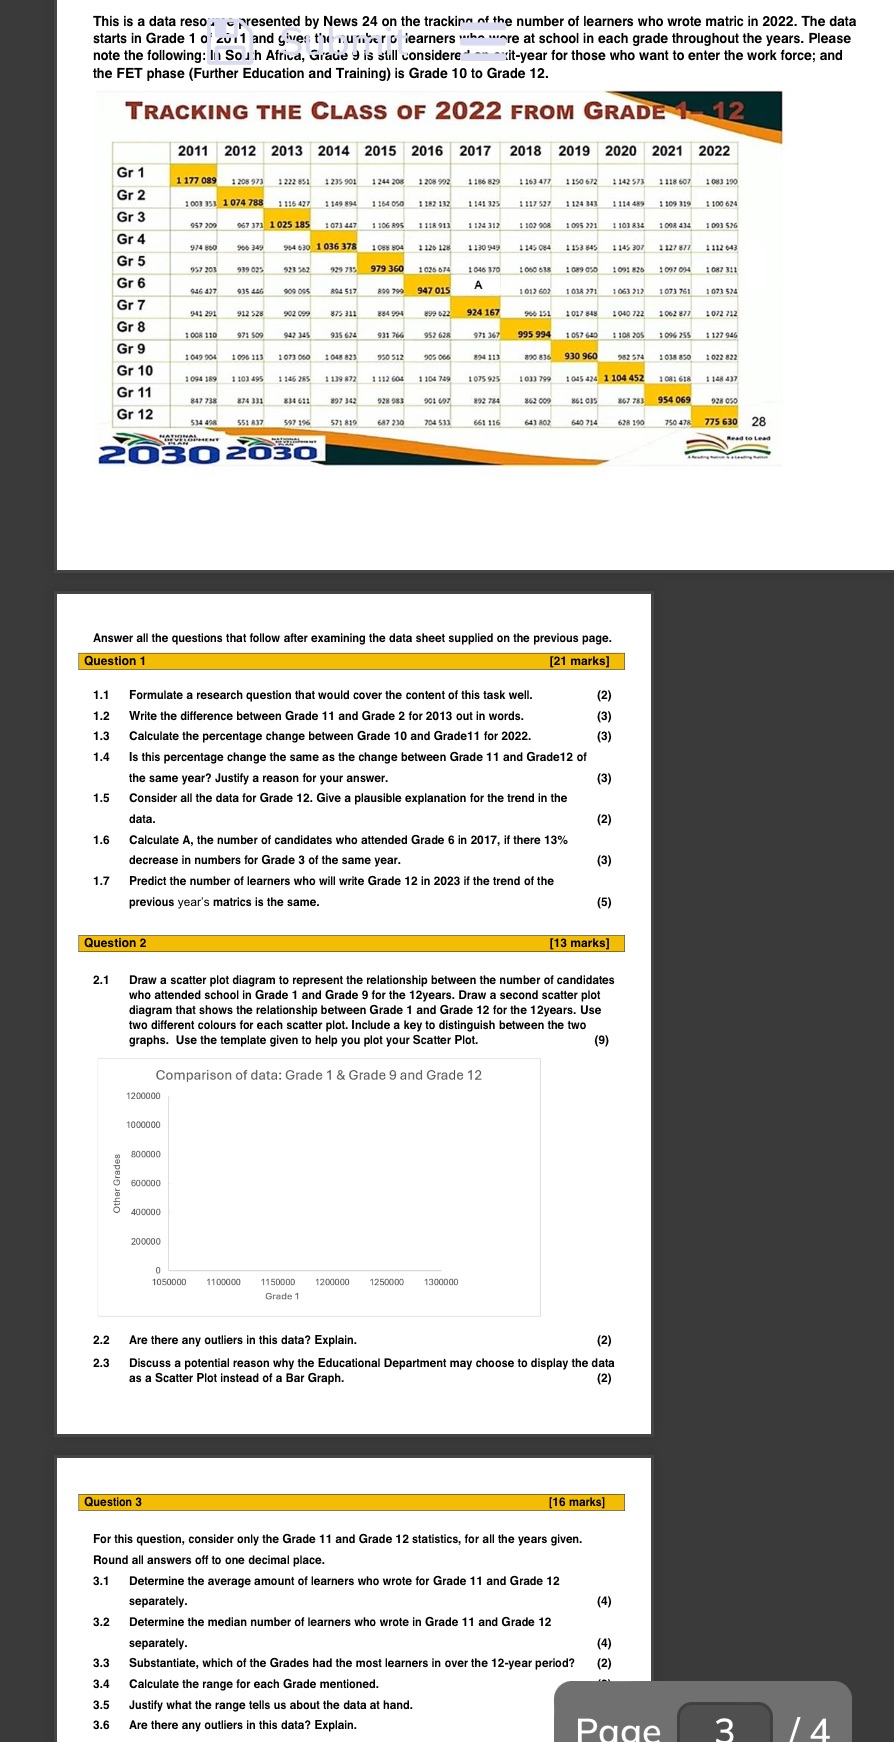
This is a data reso . e presented by News 24 on the tracking of the number of learners who wrote matric in 2022. The data starts in Grade 1 of cui1 and gives t'l number o learners who wore at school in each grade throughout the years. Please note the following: In So i h Africa, Grade 9 is still considered it-year for those who want to enter the work force; and the FET phase (Further Education and Training) is Grade 10 to Grade 12. TRACKING THE CLASS OF 2022 FROM GRADE 1 12 2011 2012 2013 2014 2015 2016 2017 2018 2019 2020 2021 2022 Gr 1 1 177 089 1 208 973 1222 851 1 235 901 1 244 208 1 208 902 1 186 829 1 163 477 1 150 672 :142 573 1218 607 1 083 190 Gr 2 1 003 353 1 074 788 1 316 427 1 149 894 1 164 050 1 182 182 1 141 325 1 117 527 1 124 343 1 114 489 1 109 319 : 100 624 Gr 3 957 209 967 373 1 025 185 1 073 447 1 106 895 1 118 913 1 124 312 1 102 908 1095 221 1 103 834 1008 434 1093 576 Gr 4 974 860 906 349 984 630 1 036 378 1 089 804 1 125 128 1 130 949 1 145 084 1 153 845 1 145 307 1127 877 1 112 643 Gr 5 057 203 939 025 923 567 929 735 979 360 1 025 874 1 046 370 1060 638 1089 050 1091 825 1097 034 1 087 311 Gr 6 46 427 894 517 809 799 947 015 A 935 446 909 095 1 012 607 1038 271 1063 212 1073 761 1073 524 Gr 7 941 291 912 528 902 099 894 994 229 668 924 167 906 151 1017 848 1040 722 1062 877 1072 712 Gr 8 1 008 110 971 509 942 345 935 624 931 746 952 628 971 367 995 994 1 057 640 1 108 205 1 096 255 1 127 946 Gr 9 1049 904 1096 113 1073 050 1 048 823 950 512 894 113 820 836 930 960 982 574 1 038 850 1 022 822 Gr 10 1 094 189 1 103 495 1 146 285 1 139 872 1 112 604 1 104 749 1 075 925 1 013 799 1 045 424 1 104 452 1 081 618 1 148 437 Gr 11 147 738 874 331 834 611 897 342 928 983 201 097 892 784 862 009 861 015 867 781 954 069 928 050 Gr 12 534 498 551 837 597 196 571 819 687 230 704 513 661 116 643 802 650 714 678 190 750 478 775 630 2 Read to Lead 20302030 Answer all the questions that follow after examining the data sheet supplied on the previous page. Question 1 [21 marks] 1.1 Formulate a research question that would cover the content of this task well. (2) 1.2 Write the difference between Grade 11 and Grade 2 for 2013 out in words. (3) 1.3 Calculate the percentage change between Grade 10 and Grade11 for 2022. (3 ) 1.4 Is this percentage change the same as the change between Grade 11 and Grade12 of the same year? Justify a reason for your answer. (3 ) 1.5 Consider all the data for Grade 12. Give a plausible explanation for the trend in the data. (2) 1.6 Calculate A, the number of candidates who attended Grade 6 in 2017, if there 13% decrease in numbers for Grade 3 of the same year. (3) 1.7 Predict the number of learners who will write Grade 12 in 2023 if the trend of the previous year's matrics is the same. (5) Question 2 [13 marks] 2.1 Draw a scatter plot diagram to represent the relationship between the number of candidates who attended school in Grade 1 and Grade 9 for the 12years. Draw a second scatter plot diagram that shows the relationship between Grade 1 and Grade 12 for the 12years. Use two different colours for each scatter plot. Include a key to distinguish between the two graphs. Use the template given to help you plot your Scatter Plot. Comparison of data: Grade 1 & Grade 9 and Grade 12 1200000 1000000 800000 Other Grades 600000 400000 200000 1050000 1100000 1150DOD 1200000 12500DO 1300000 Grade 1 2.2 Are there any outliers in this data? Explain. (2) 2.3 Discuss a potential reason why the Educational Department may choose to display the data as a Scatter Plot instead of a Bar Graph. (2) Question 3 [16 marks] For this question, consider only the Grade 11 and Grade 12 statistics, for all the years given. Round all answers off to one decimal place. 3.1 Determine the average amount of learners who wrote for Grade 11 and Grade 12 separately (4) 3.2 Determine the median number of learners who wrote in Grade 11 and Grade 12 separately. (4) 3.3 Substantiate, which of the Grades had the most learners in over the 12-year period? ( 2 ) 3.4 Calculate the range for each Grade mentioned. 3.5 Justify what the range tells us about the data at hand. 3.6 Are there any outliers in this data? Explain. Page 3 14
Step by Step Solution
There are 3 Steps involved in it

Get step-by-step solutions from verified subject matter experts