

Question: This is a First Post discussion, answer the questions and check each other's work. Problem 1 a. Using the following sales data, prepare a chart
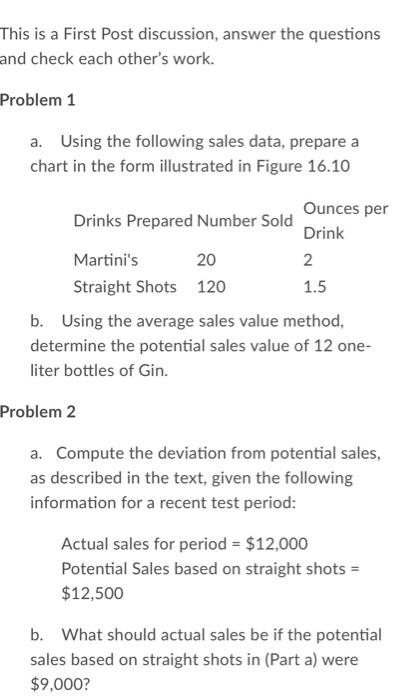
This is a First Post discussion, answer the questions and check each other's work. Problem 1 a. Using the following sales data, prepare a chart in the form illustrated in Figure 16.10 Ounces per Drinks Prepared Number Sold Drink Martini's 20 2 Straight Shots 120 1.5 b. Using the average sales value method, determine the potential sales value of 12 one- liter bottles of Gin. Problem 2 a. Compute the deviation from potential sales, as described in the text, given the following information for a recent test period: Actual sales for period = $12,000 Potential Sales based on straight shots = $12,500 b. What should actual sales be if the potential sales based on straight shots in (Part a) were $9,000? This is a First Post discussion, answer the questions and check each other's work. Problem 1 a. Using the following sales data, prepare a chart in the form illustrated in Figure 16.10 Ounces per Drinks Prepared Number Sold Drink Martini's 20 2 Straight Shots 120 1.5 b. Using the average sales value method, determine the potential sales value of 12 one- liter bottles of Gin. Problem 2 a. Compute the deviation from potential sales, as described in the text, given the following information for a recent test period: Actual sales for period = $12,000 Potential Sales based on straight shots = $12,500 b. What should actual sales be if the potential sales based on straight shots in (Part a) were $9,000
Step by Step Solution
There are 3 Steps involved in it

Get step-by-step solutions from verified subject matter experts