

Question: This is a Gizmo assignment please helplink: Estimating Population Size www.explorelearning.com VSC Experiment 3: Rainbow Trout Suppose 75 tagged rainbow trout were released into the
This is a Gizmo assignment please helplink: Estimating Population Size www.explorelearning.com
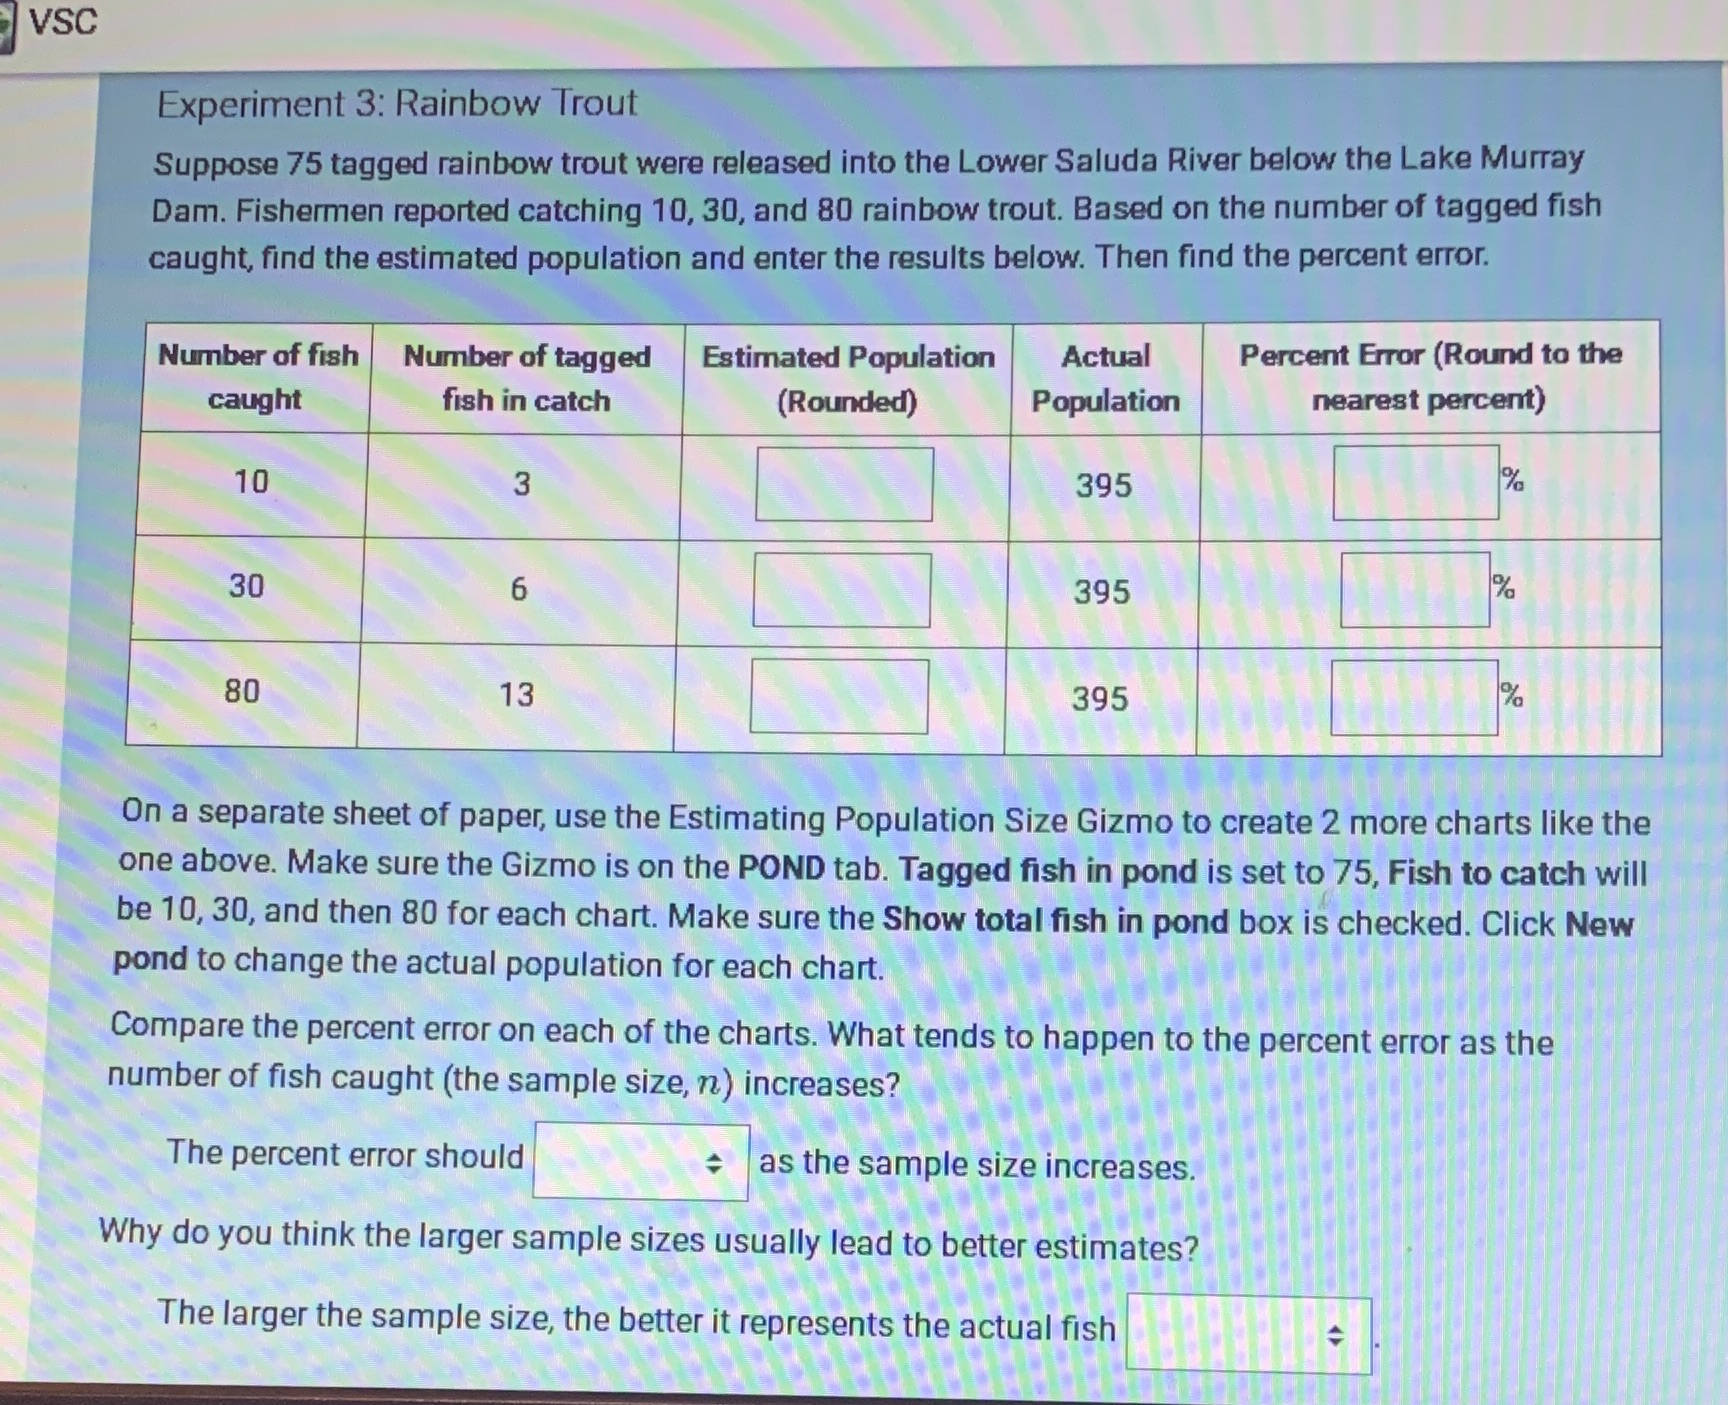
VSC Experiment 3: Rainbow Trout Suppose 75 tagged rainbow trout were released into the Lower Saluda River below the Lake Murray Dam. Fishermen reported catching 10, 30, and 80 rainbow trout. Based on the number of tagged fish caught, find the estimated population and enter the results below. Then find the percent error. Number of fish Number of tagged Estimated Population Actual Percent Error (Round to the caught fish in catch (Rounded) Population nearest percent) 10 3 395 30 6 395 % 80 13 395 On a separate sheet of paper, use the Estimating Population Size Gizmo to create 2 more charts like the one above. Make sure the Gizmo is on the POND tab. Tagged fish in pond is set to 75, Fish to catch will be 10, 30, and then 80 for each chart. Make sure the Show total fish in pond box is checked. Click New pond to change the actual population for each chart. Compare the percent error on each of the charts. What tends to happen to the percent error as the number of fish caught (the sample size, n) increases? The percent error should as the sample size increases. Why do you think the larger sample sizes usually lead to better estimates? The larger the sample size, the better it represents the actual fish
Step by Step Solution
There are 3 Steps involved in it

Get step-by-step solutions from verified subject matter experts