

Question: This is a group project activity. Refer to 5 . 1 MATLAB Group Project: Getting Started or your Groups area in Canvas to review your
This is a group project activity. Refer to MATLAB Group Project: Getting Started or your Groups area in Canvas to review your group's plan for
completing this project. This project includes writing a MATLAB script to generate plots for the problem.
In Module your group will submit a final report on this project. Review MATLAB Group Project: Final Report for complete details about what
is expected for the final report.
Oblique Balance
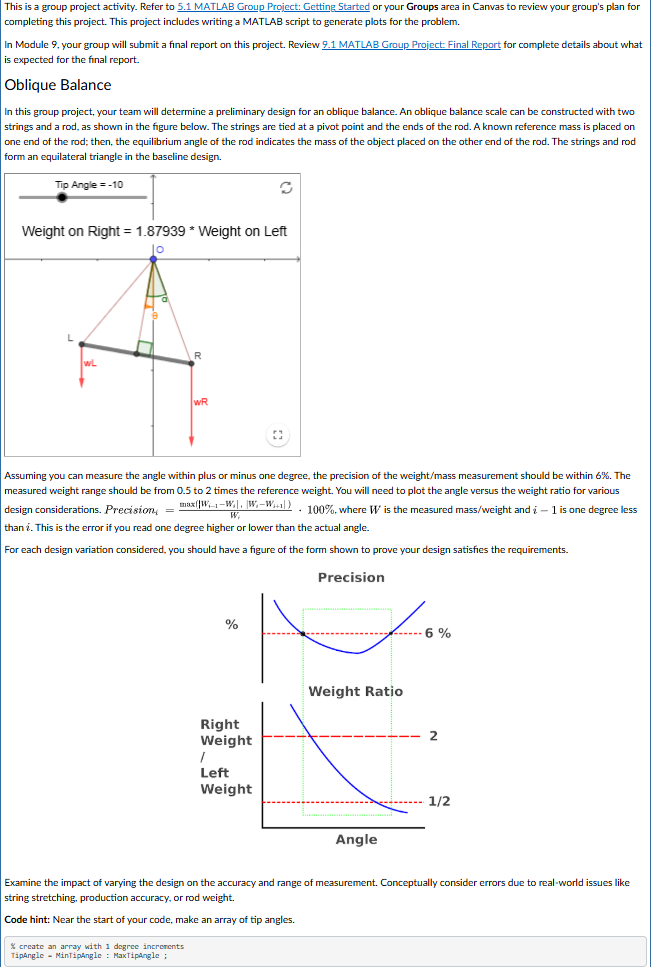
In this group project, your team will determine a preliminary design for an oblique balance. An oblique balance scale can be constructed with two
strings and a rod, as shown in the figure below. The strings are tied at a pivot point and the ends of the rod. A known reference mass is placed on
one end of the rod; then, the equilibrium angle of the rod indicates the mass of the object placed on the other end of the rod. The strings and rod
form an equilateral triangle in the baseline design.
Assuming you can measure the angle within plus or minus one degree, the precision of the weightmass measurement should be within The
measured weight range should be from to times the reference weight. You will need to plot the angle versus the weight ratio for various
design considerations. Precision imaxWiWiWiWiWi where W is the measured massweight and i is one degree less
than i This is the error if you read one degree higher or lower than the actual angle.
For each design variation considered, you should have a figure of the form shown to prove your design satisfies the requirements.
Examine the impact of varying the design on the accuracy and range of measurement. Conceptually consider errors due to realworld issues like
string stretching, production accuracy, or rod weight.
Code hint: Near the start of your code, make an array of tip angles.
create an array with degree increrents
TipAngle MinTipAngle : MaxtipAngle ;
I need help with the MATLAB code. I've tried to program and I cant seem to get my graphs to match what is shown.
Step by Step Solution
There are 3 Steps involved in it
1 Expert Approved Answer
Step: 1 Unlock

Question Has Been Solved by an Expert!
Get step-by-step solutions from verified subject matter experts
Step: 2 Unlock
Step: 3 Unlock