

Question: this is a investment research method question about trading strategy based on corporate bond, fixed income security, could you please explain this table? how I
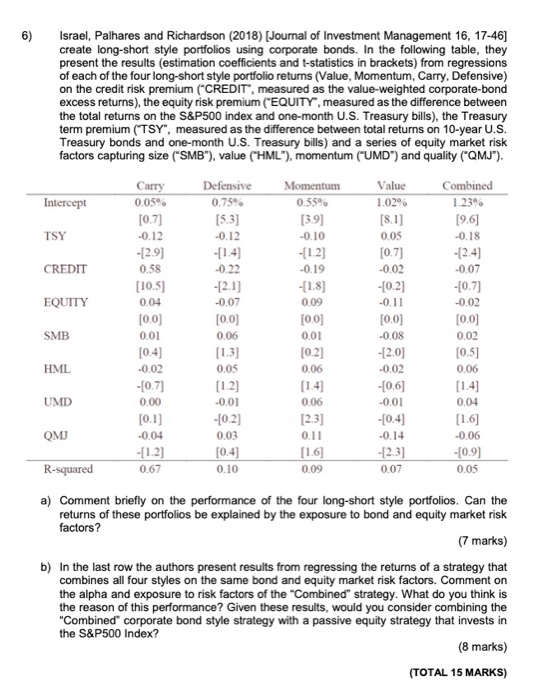
6) Israel, Palhares and Richardson (2018) (Journal of Investment Management 16, 17-46] create long-short style portfolios using corporate bonds. In the following table, they present the results (estimation coefficients and t-statistics in brackets) from regressions of each of the four long-short style portfolio returns (Value, Momentum, Carry, Defensive) on the credit risk premium (CREDIT, measured as the value-weighted corporate-bond excess returns), the equity risk premium ("EQUITY, measured as the difference between the total returns on the S&P500 index and one-month U.S. Treasury bills), the Treasury term premium ("TSY", measured as the difference between total returns on 10-year U.S. Treasury bonds and one-month U.S. Treasury bills) and a series of equity market risk factors capturing size (SMB), value ("HML"), momentum (UMD") and quality (QMJ"). Intercept Camry 0.05% [0.7) -0.12 - (2.9) Defensive 0.75% [5.3] -0.12 - (1.4) TSY CREDIT 0.58 -0.22 -2.1] Momentum 0.559 [3.9) -0.10 -[1.2] -0.19 -[1.8) 0.09 [0,0] 0.01 [0.2] 0.06 Combined 1.23% [9.6] -0.18 - [2.4) -0.07 -0.7) -0.02 [0,0] 0.02 (0.5) 0.06 EQUITY -0.07 Value 1.02 [8.1) 0.05 [0.7) -0.02 -[0.2) -0.11 [0,0] -0.08 - [2.0) -0.02 -[0.6) -0.01 -(0.4) -0.14 -[2.3) 0.07 [0,0] 0.06 [1.3) 0.05 SMB [10.5) 0.04 [0.0) 0.01 (0.4) -0.02 -[0.7) 0.00 [0.1) -0.04 -[12] 0.67 HML (1.2) UMD 0.06 QMJ -0.01 -[0.2) 0.03 (0.4) 0.10 [2.3) 0.11 [16] 0.09 0.04 (1.6) -0.06 -[0.9) 0.05 R-squared a) Comment briefly on the performance of the four long-short style portfolios. Can the ortfolios be explained by the exposure to bond and equity market risk factors? (7 marks) b) In the last row the authors present results from regressing the returns of a strategy that combines all four styles on the same bond and equity market risk factors. Comment on the alpha and exposure to risk factors of the "Combined strategy. What do you think is the reason of this performance? Given these results, would you consider combining the "Combined corporate bond style strategy with a passive equity strategy that invests in the S&P500 Index? (8 marks) (TOTAL 15 MARKS) 6) Israel, Palhares and Richardson (2018) (Journal of Investment Management 16, 17-46] create long-short style portfolios using corporate bonds. In the following table, they present the results (estimation coefficients and t-statistics in brackets) from regressions of each of the four long-short style portfolio returns (Value, Momentum, Carry, Defensive) on the credit risk premium (CREDIT, measured as the value-weighted corporate-bond excess returns), the equity risk premium ("EQUITY, measured as the difference between the total returns on the S&P500 index and one-month U.S. Treasury bills), the Treasury term premium ("TSY", measured as the difference between total returns on 10-year U.S. Treasury bonds and one-month U.S. Treasury bills) and a series of equity market risk factors capturing size (SMB), value ("HML"), momentum (UMD") and quality (QMJ"). Intercept Camry 0.05% [0.7) -0.12 - (2.9) Defensive 0.75% [5.3] -0.12 - (1.4) TSY CREDIT 0.58 -0.22 -2.1] Momentum 0.559 [3.9) -0.10 -[1.2] -0.19 -[1.8) 0.09 [0,0] 0.01 [0.2] 0.06 Combined 1.23% [9.6] -0.18 - [2.4) -0.07 -0.7) -0.02 [0,0] 0.02 (0.5) 0.06 EQUITY -0.07 Value 1.02 [8.1) 0.05 [0.7) -0.02 -[0.2) -0.11 [0,0] -0.08 - [2.0) -0.02 -[0.6) -0.01 -(0.4) -0.14 -[2.3) 0.07 [0,0] 0.06 [1.3) 0.05 SMB [10.5) 0.04 [0.0) 0.01 (0.4) -0.02 -[0.7) 0.00 [0.1) -0.04 -[12] 0.67 HML (1.2) UMD 0.06 QMJ -0.01 -[0.2) 0.03 (0.4) 0.10 [2.3) 0.11 [16] 0.09 0.04 (1.6) -0.06 -[0.9) 0.05 R-squared a) Comment briefly on the performance of the four long-short style portfolios. Can the ortfolios be explained by the exposure to bond and equity market risk factors? (7 marks) b) In the last row the authors present results from regressing the returns of a strategy that combines all four styles on the same bond and equity market risk factors. Comment on the alpha and exposure to risk factors of the "Combined strategy. What do you think is the reason of this performance? Given these results, would you consider combining the "Combined corporate bond style strategy with a passive equity strategy that invests in the S&P500 Index? (8 marks) (TOTAL 15 MARKS)
Step by Step Solution
There are 3 Steps involved in it

Get step-by-step solutions from verified subject matter experts