

Question: this is a Location Analysis question. Consider the following supply chain for widgets which includes two widget component manufacturers (Crox Widgets and National Widget Manufacturers)
this is a Location Analysis question.
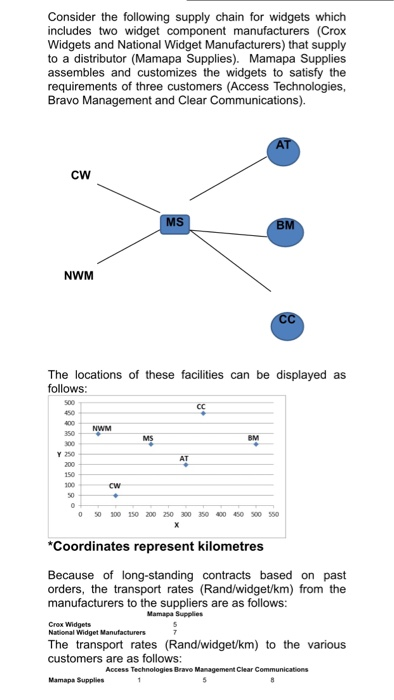
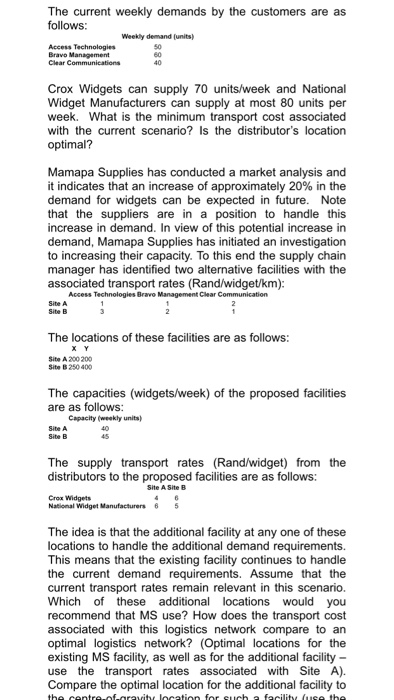
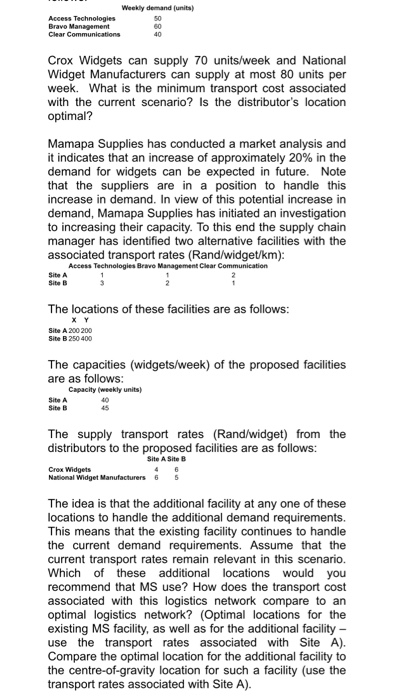
Consider the following supply chain for widgets which includes two widget component manufacturers (Crox Widgets and National Widget Manufacturers) that supply to a distributor (Mamapa Supplies). Mamapa Supplies assembles and customizes the widgets to satisfy the requirements of three customers (Access Technologies, Bravo Management and Clear Communications). CW MS BM NWM The locations of these facilities can be displayed as follows: NWM MS BM AT 400 350 300 Y 250 200 150 300 50 0 0 CW . 50 100 150 200 250 300 350 400 450 500 550 X *Coordinates represent kilometres Because of long-standing contracts based on past orders, the transport rates (Rand/widget/km) from the manufacturers to the suppliers are as follows: Mamapa Supplies Crox Widgets National Widget Manufacturers The transport rates (Rand/widget/km) to the various customers are as follows: Access Technologies Brave Management Clear Communications Mamapa Supplies The current weekly demands by the customers are as follows: Weekly demand (units) Access Technologies Bravo Management Clear Communications 60 40 Crox Widgets can supply 70 units/week and National Widget Manufacturers can supply at most 80 units per week. What is the minimum transport cost associated with the current scenario? Is the distributor's location optimal? Mamapa Supplies has conducted a market analysis and it indicates that an increase of approximately 20% in the demand for widgets can be expected in future. Note that the suppliers are in a position to handle this increase in demand. In view of this potential increase in demand, Mamapa Supplies has initiated an investigation to increasing their capacity. To this end the supply chain manager has identified two alternative facilities with the associated transport rates (Rand/widget/km): Access Technologies Bravo Management Clear Communication Site A Site B The locations of these facilities are as follows: Site A 200 200 Site B 250 400 X Y The capacities (widgets/week) of the proposed facilities are as follows: Capacity (weekly units) Site A Site B 45 The supply transport rates (Rand/widget) from the distributors to the proposed facilities are as follows: Site A Site B Crex Widgets National Widget Manufacturers 6 The idea is that the additional facility at any one of these locations to handle the additional demand requirements. This means that the existing facility continues to handle the current demand requirements. Assume that the current transport rates remain relevant in this scenario. Which of these additional locations would you recommend that MS use? How does the transport cost associated with this logistics network compare to an optimal logistics network? Optimal locations for the existing MS facility, as well as for the additional facility - use the transport rates associated with Site A). Compare the optimal location for the additional facility to the centre of oravity location for such a facility Ince the Weekly demand (units) Access Technologies 50 Bravo Management 60 Clear Communications 40 Crox Widgets can supply 70 units/week and National Widget Manufacturers can supply at most 80 units per week. What is the minimum transport cost associated with the current scenario? is the distributor's location optimal? Mamapa Supplies has conducted a market analysis and it indicates that an increase of approximately 20% in the demand for widgets can be expected in future. Note that the suppliers are in a position to handle this increase in demand. In view of this potential increase in demand, Mamapa Supplies has initiated an investigation to increasing their capacity. To this end the supply chain manager has identified two alternative facilities with the associated transport rates (Rand/widget/km): Access Technologies Bravo Management Clear Communication Site A Site B The locations of these facilities are as follows: Site A 200 200 X Y Site B 250 400 The capacities (widgets/week) of the proposed facilities are as follows: Capacity (weekly units) 40 Site A Site B The supply transport rates (Rand/widget) from the distributors to the proposed facilities are as follows: Site A Site B Crox Widgets National Widget Manufacturers The idea is that the additional facility at any one of these locations to handle the additional demand requirements. This means that the existing facility continues to handle the current demand requirements. Assume that the current transport rates remain relevant in this scenario. Which of these additional locations would you recommend that MS use? How does the transport cost associated with this logistics network compare to an optimal logistics network? (Optimal locations for the existing MS facility, as well as for the additional facility - use he transport rates associated with Site Compare the optimal location for the additional facility to the centre-of-gravity location for such a facility (use the transport rates associated with Site A). Consider the following supply chain for widgets which includes two widget component manufacturers (Crox Widgets and National Widget Manufacturers) that supply to a distributor (Mamapa Supplies). Mamapa Supplies assembles and customizes the widgets to satisfy the requirements of three customers (Access Technologies, Bravo Management and Clear Communications). CW MS BM NWM The locations of these facilities can be displayed as follows: NWM MS BM AT 400 350 300 Y 250 200 150 300 50 0 0 CW . 50 100 150 200 250 300 350 400 450 500 550 X *Coordinates represent kilometres Because of long-standing contracts based on past orders, the transport rates (Rand/widget/km) from the manufacturers to the suppliers are as follows: Mamapa Supplies Crox Widgets National Widget Manufacturers The transport rates (Rand/widget/km) to the various customers are as follows: Access Technologies Brave Management Clear Communications Mamapa Supplies The current weekly demands by the customers are as follows: Weekly demand (units) Access Technologies Bravo Management Clear Communications 60 40 Crox Widgets can supply 70 units/week and National Widget Manufacturers can supply at most 80 units per week. What is the minimum transport cost associated with the current scenario? Is the distributor's location optimal? Mamapa Supplies has conducted a market analysis and it indicates that an increase of approximately 20% in the demand for widgets can be expected in future. Note that the suppliers are in a position to handle this increase in demand. In view of this potential increase in demand, Mamapa Supplies has initiated an investigation to increasing their capacity. To this end the supply chain manager has identified two alternative facilities with the associated transport rates (Rand/widget/km): Access Technologies Bravo Management Clear Communication Site A Site B The locations of these facilities are as follows: Site A 200 200 Site B 250 400 X Y The capacities (widgets/week) of the proposed facilities are as follows: Capacity (weekly units) Site A Site B 45 The supply transport rates (Rand/widget) from the distributors to the proposed facilities are as follows: Site A Site B Crex Widgets National Widget Manufacturers 6 The idea is that the additional facility at any one of these locations to handle the additional demand requirements. This means that the existing facility continues to handle the current demand requirements. Assume that the current transport rates remain relevant in this scenario. Which of these additional locations would you recommend that MS use? How does the transport cost associated with this logistics network compare to an optimal logistics network? Optimal locations for the existing MS facility, as well as for the additional facility - use the transport rates associated with Site A). Compare the optimal location for the additional facility to the centre of oravity location for such a facility Ince the Weekly demand (units) Access Technologies 50 Bravo Management 60 Clear Communications 40 Crox Widgets can supply 70 units/week and National Widget Manufacturers can supply at most 80 units per week. What is the minimum transport cost associated with the current scenario? is the distributor's location optimal? Mamapa Supplies has conducted a market analysis and it indicates that an increase of approximately 20% in the demand for widgets can be expected in future. Note that the suppliers are in a position to handle this increase in demand. In view of this potential increase in demand, Mamapa Supplies has initiated an investigation to increasing their capacity. To this end the supply chain manager has identified two alternative facilities with the associated transport rates (Rand/widget/km): Access Technologies Bravo Management Clear Communication Site A Site B The locations of these facilities are as follows: Site A 200 200 X Y Site B 250 400 The capacities (widgets/week) of the proposed facilities are as follows: Capacity (weekly units) 40 Site A Site B The supply transport rates (Rand/widget) from the distributors to the proposed facilities are as follows: Site A Site B Crox Widgets National Widget Manufacturers The idea is that the additional facility at any one of these locations to handle the additional demand requirements. This means that the existing facility continues to handle the current demand requirements. Assume that the current transport rates remain relevant in this scenario. Which of these additional locations would you recommend that MS use? How does the transport cost associated with this logistics network compare to an optimal logistics network? (Optimal locations for the existing MS facility, as well as for the additional facility - use he transport rates associated with Site Compare the optimal location for the additional facility to the centre-of-gravity location for such a facility (use the transport rates associated with Site A)
Step by Step Solution
There are 3 Steps involved in it
1 Expert Approved Answer
Step: 1 Unlock

Question Has Been Solved by an Expert!
Get step-by-step solutions from verified subject matter experts
Step: 2 Unlock
Step: 3 Unlock