

Question: This is a mathlab problem Set axis equal on all plots. Question 1. Use the plot command to plot a RED square uwith side length
 This is a mathlab problem
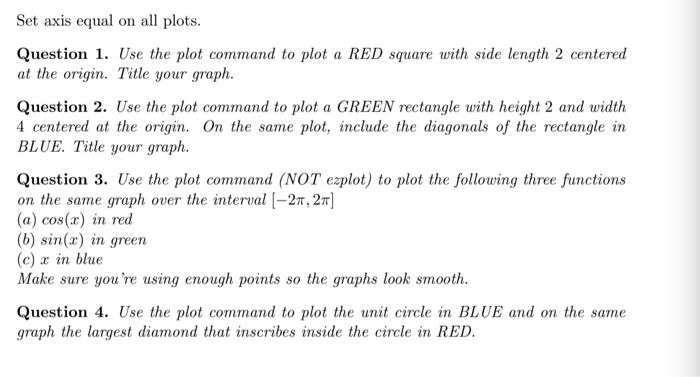
 Set axis equal on all plots. Question 1. Use the plot command to plot a RED square uwith side length 2 centered at the origin. Title your graph. Question 2. Use the plot command to plot a GREEN rectangle with height 2 and width 4 centered at the origin. On the same plot, include the diagonals of the rectangle in BLUE. Title your graph. Question 3. Use the plot command (NOT ezplot) to plot the following three functions on the same graph over the interval [-2, 2] (a) cos(a) in red (b) sin(x) in green (c) in blue Make sure you're using enough points so the graphs look smooth. Question 4. Use the plot command to plot the unit circle in BLUE and on the same graph the largest diamond that inscribes inside the circle in RED
Step by Step Solution
There are 3 Steps involved in it

Get step-by-step solutions from verified subject matter experts