

Question: Download the file MPG.dat from the course website. This is a two-column data file. The 53 31.0 first column is the day since 1
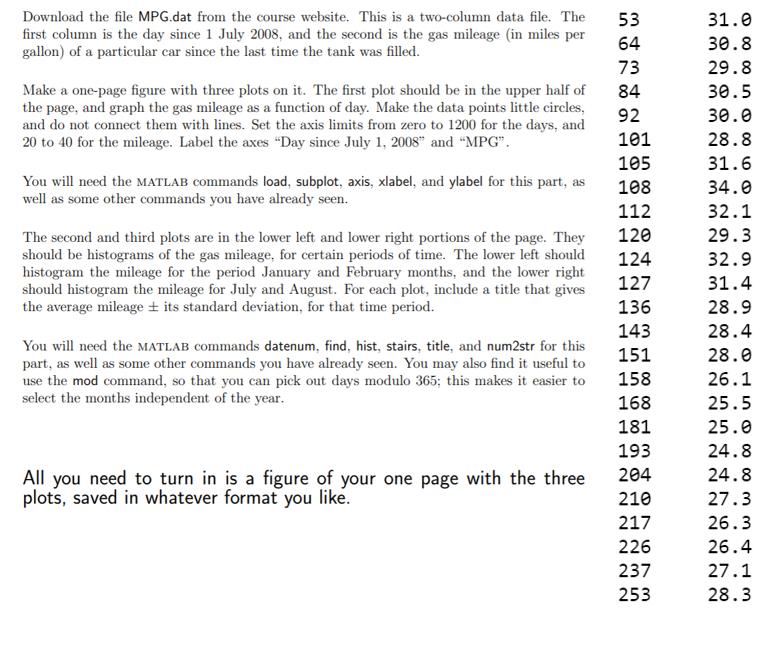
Download the file MPG.dat from the course website. This is a two-column data file. The 53 31.0 first column is the day since 1 July 2008, and the second is the gas mileage (in miles per gallon) of a particular car since the last time the tank was filled. 64 30.8 73 29.8 Make a one-page figure with three plots on it. The first plot should be in the upper half of the page, and graph the gas mileage as a function of day. Make the data points little circles, and do not connect them with lines. Set the axis limits from zero to 1200 for the days, and 20 to 40 for the mileage. Label the axes "Day since July 1, 2008" and "MPG". 84 30.5 92 30.0 101 28.8 105 31.6 You will need the MATLAB commands load, subplot, axis, xlabel, and ylabel for this part, as well as some other commands you have already seen. 108 34.0 112 32.1 120 29.3 The second and third plots are in the lower left and lower right portions of the page. They should be histograms of the gas mileage, for certain periods of time. The lower left should histogram the mileage for the period January and February months, and the lower right should histogram the mileage for July and August. For each plot, include a title that gives the average mileage + its standard deviation, for that time period. 124 32.9 127 31.4 136 28.9 143 28.4 You will need the MATLAB commands datenum, find, hist, stairs, title, and num2str for this 151 28.0 part, as well as some other commands you have already seen. You may also find it useful to use the mod command, so that you can pick out days modulo 365; this makes it easier to select the months independent of the year. 158 26.1 168 25.5 181 25.0 193 24.8 204 24.8 All you need to turn in is a figure of your one page with the three plots, saved in whatever format you like. 210 27.3 217 26.3 226 26.4 237 27.1 253 28.3
Step by Step Solution
3.44 Rating (167 Votes )
There are 3 Steps involved in it
MATLAB Code for plotting given requirements is given below Comments are included in the code for bet... View full answer

Get step-by-step solutions from verified subject matter experts