

Question: This is a matlab problem, please help me complete the code and questions, thanks! The part of code provided: % % w02w_GEerr.m -- GE truncation
This is a matlab problem, please help me complete the code and questions, thanks!
The part of code provided:
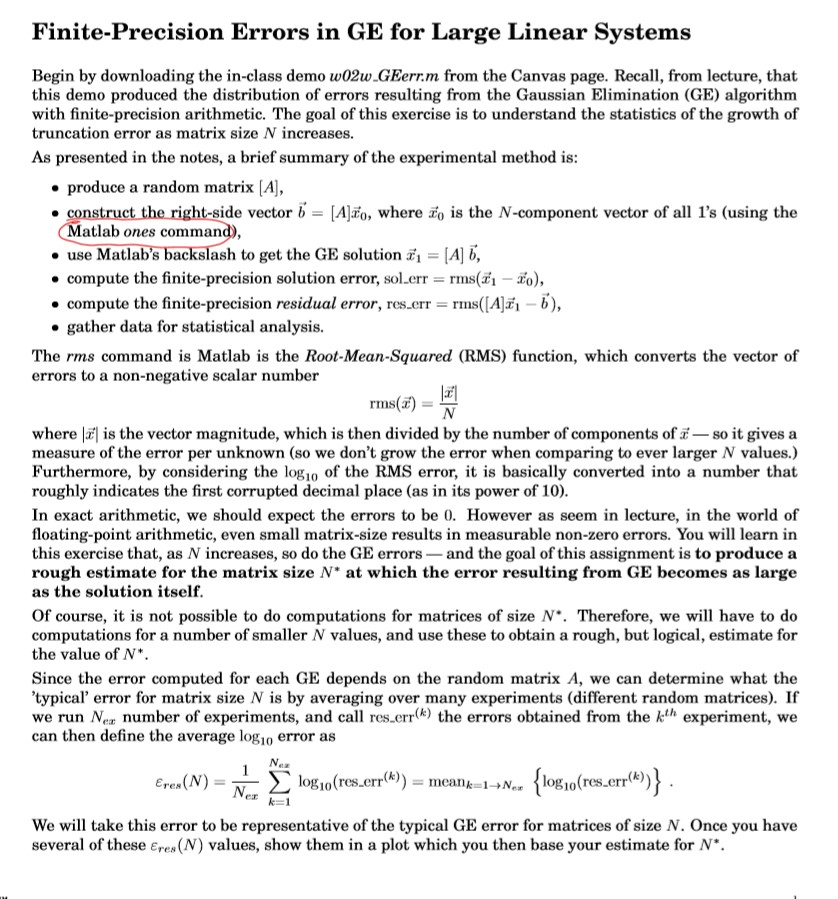
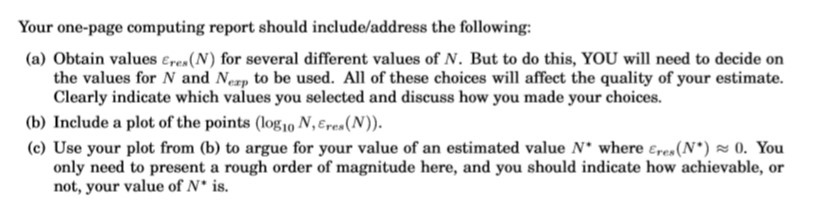
% % w02w_GEerr.m -- GE truncation error (djm -- 08 sep 2019) % % N = matrix size; Nex = # of experiments N = 1*128 Nex = 1*100; % solution of all ones x0 = ones(N,1); % data vector of errors res_err = zeros(Nex,1); sol_err = zeros(Nex,1); for kk = 1:Nex % make random matrix & b-vector A = eye(N,N) + randn(N,N)/sqrt(N); b = A*x0; % GE via backslash x1 = A b; % rms residual error res_err(kk) = rms(A*x1-b); % rms solution error sol_err(kk) = rms(x1-x0); end % histogram for residual error figure(1); clf subplot(2,1,1) hist(log10(res_err),20) % mean & variance min_re = min(log10(res_err)); string = ['mean = ' num2str(mean(log10(res_err)))] text(min_re,0.10*Nex,string,'fontsize',12) string = ['var = ' num2str(var(log10(res_err)))] text(min_re,0.08*Nex,string,'fontsize',12) % axis labels xlabel('log_{10} rms error','fontsize',12) ylabel(['number from ' num2str(Nex) ' experiments']) title('residual error: A x_1- b','fontsize',14) % plot for solution error subplot(2,1,2) hist(log10(sol_err),20) xlabel('log_{10} rms error','fontsize',12) ylabel(['number from ' num2str(Nex) ' experiments']) title('solution error: x_1-x_0','fontsize',14)Finite-Precision Errors in GE for Large Linear Systems Begin by downloading the in-class demo w02wGEerr.m from the Canvas page. Recall, from lecture, that this demo produced the distribution of errors resulting from the Gaussian Elimination (GE) algorithm with finite-precision arithmetic. The goal of this exercise is to understand the statistics of the growth of truncation error as matrix size N increases. As presented in the notes, a brief summary of the experimental method is produce a random matrix [A econ t-side vector bAjzo, where do is the N-component vector of all 1's (using the atlab ones comman use Matlab's backslash to get the GE solution [A b, compute the finite-precision solution error, sol-err = rms(Z1-20), compute the finite-precision residual error, res.er[A -b), . gather data for statistical analysis. The rms command is Matlab is the Root-Mean-Squared (RMS) function, which converts the vector of errors to a non-negative scalar number rms(z) where is the vector magnitude, which is then divided by the number of components of so it gives a measure of the error per unknown (so we don't grow the error when comparing to ever larger N values.) Furthermore, by considering the logo of the RMS error, it is basically converted into a number that roughly indicates the first corrupted decimal place (as in its power of 10) In exact arithmetic, we should expect the errors to be 0. However as seem in lecture, in the world of floating-point arithmetic, even small matrix-size results in measurable non-zero errors. You will learn in this exercise that, as N increases, so do the GE errors -and the goal of this assignment is to produce a rough estimate for the matrix size N* at which the error resulting from GE becomes as large as the solution itself Of course, it is not possible to do computations for matrices of size N*. Therefore, we will have to do computations for a number of smaller N values, and use these to obtain a rough, but logical, estimate for the value of N. Since the error computed for each GE depends on the random matrix A, we can determine what the typical' error for matrix size N is by averaging over many experiments (different random matrices). If we run Nez number of experiments, and call res-err the errors obtained from the kth experiment, we can then define the average logio error as N. Epes(N)- log10(rs.crr(k))-: mearle-1+N..(log10(res.err(k))} We will take this error to be representative of the typical GE error for matrices of size N. Once you have several of these Eres (N) values, show them in a plot which you then base your estimate for N Your one-page computing report should include/address the following: (a) Obtain values Era(N) for several different values of N. But to do this, YOU will need to decide on the values for N and Nerp to be used. All of these choices will affect the quality of your estimate. Clearly indicate which values you selected and discuss how you made your choices. (b) Include a plot of the points (log10 N, Erea(N)) (c) Use your plot from (b) to argue for your value of an estimated value N where Er(N) O. You only need to present a rough order of magnitude here, and you should indicate how achievable, or not, your value of N" is
Step by Step Solution
There are 3 Steps involved in it

Get step-by-step solutions from verified subject matter experts