

Question: This is a matlab question : Problem 4. A file called incosts.dat stores for a company some cost and sales figures for the last n
This is a matlab question :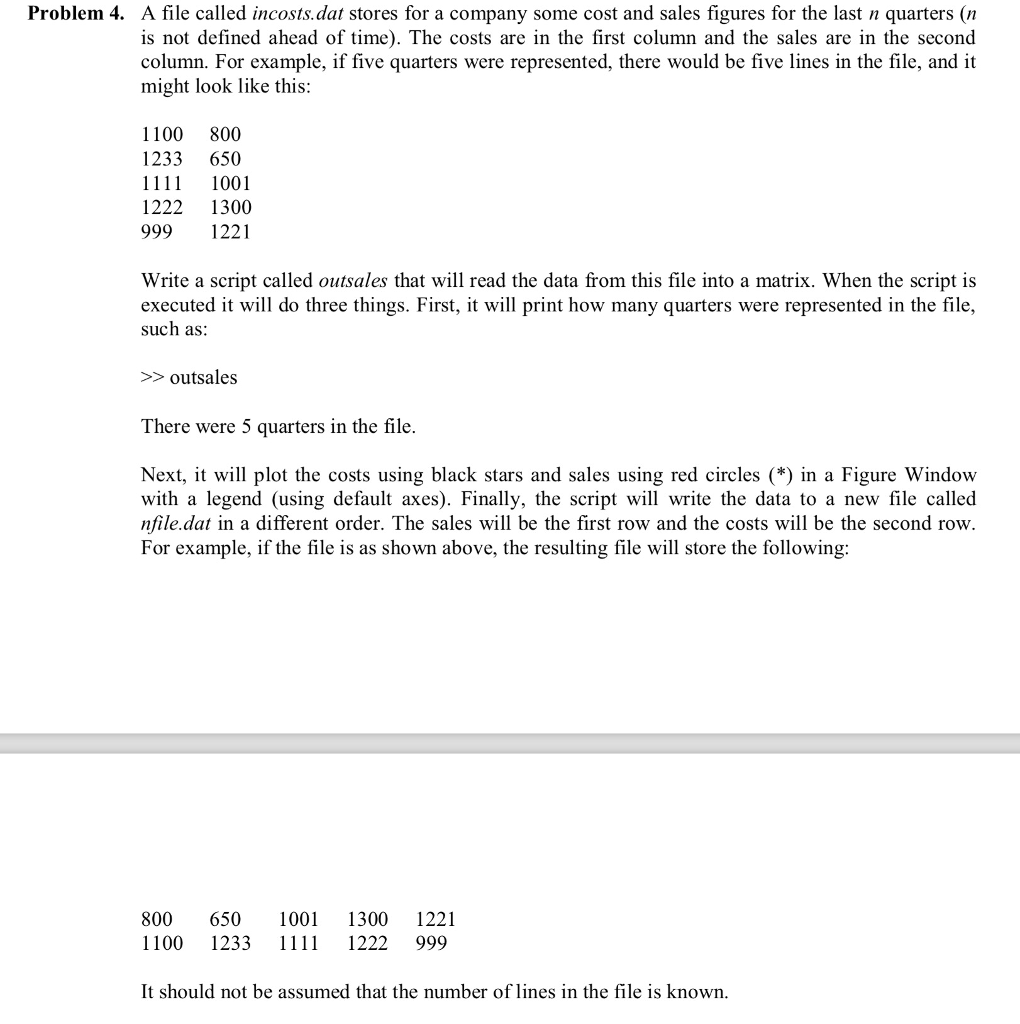
Problem 4. A file called incosts.dat stores for a company some cost and sales figures for the last n quarters (n is not defined ahead of time). The costs are in the first column and the sales are in the second column. For example, if five quarters were represented, there would be five lines in the file, and it might look like this: 1100 800 1233 650 1001 222 1300 999 1221 Write a script called outsales that will read the data from this file into a matrix. When the script is executed it will do three things. First, it will print how many quarters were represented in the file, such as: outsales There were 5 quarters in the file Next, it will plot the costs using black stars and sales using red circles (*) in a Figure Window with a legend (using default axes). Finally, the script will write the data to a new file called nfile.dat in a different order. The sales will be the first row and the costs will be the second row. For example, if the file is as shown above, the resulting file will store the following: 800 650 1001 1300 1221 1100 1233111 1222 999 It should not be assumed that the number of lines in the file is known
Step by Step Solution
There are 3 Steps involved in it

Get step-by-step solutions from verified subject matter experts