

Question: this is a multiple choice question Consider the following graph: Price p M50?) Demand Quantitvq The area of the yellow region equals: a) the producer

this is a multiple choice question
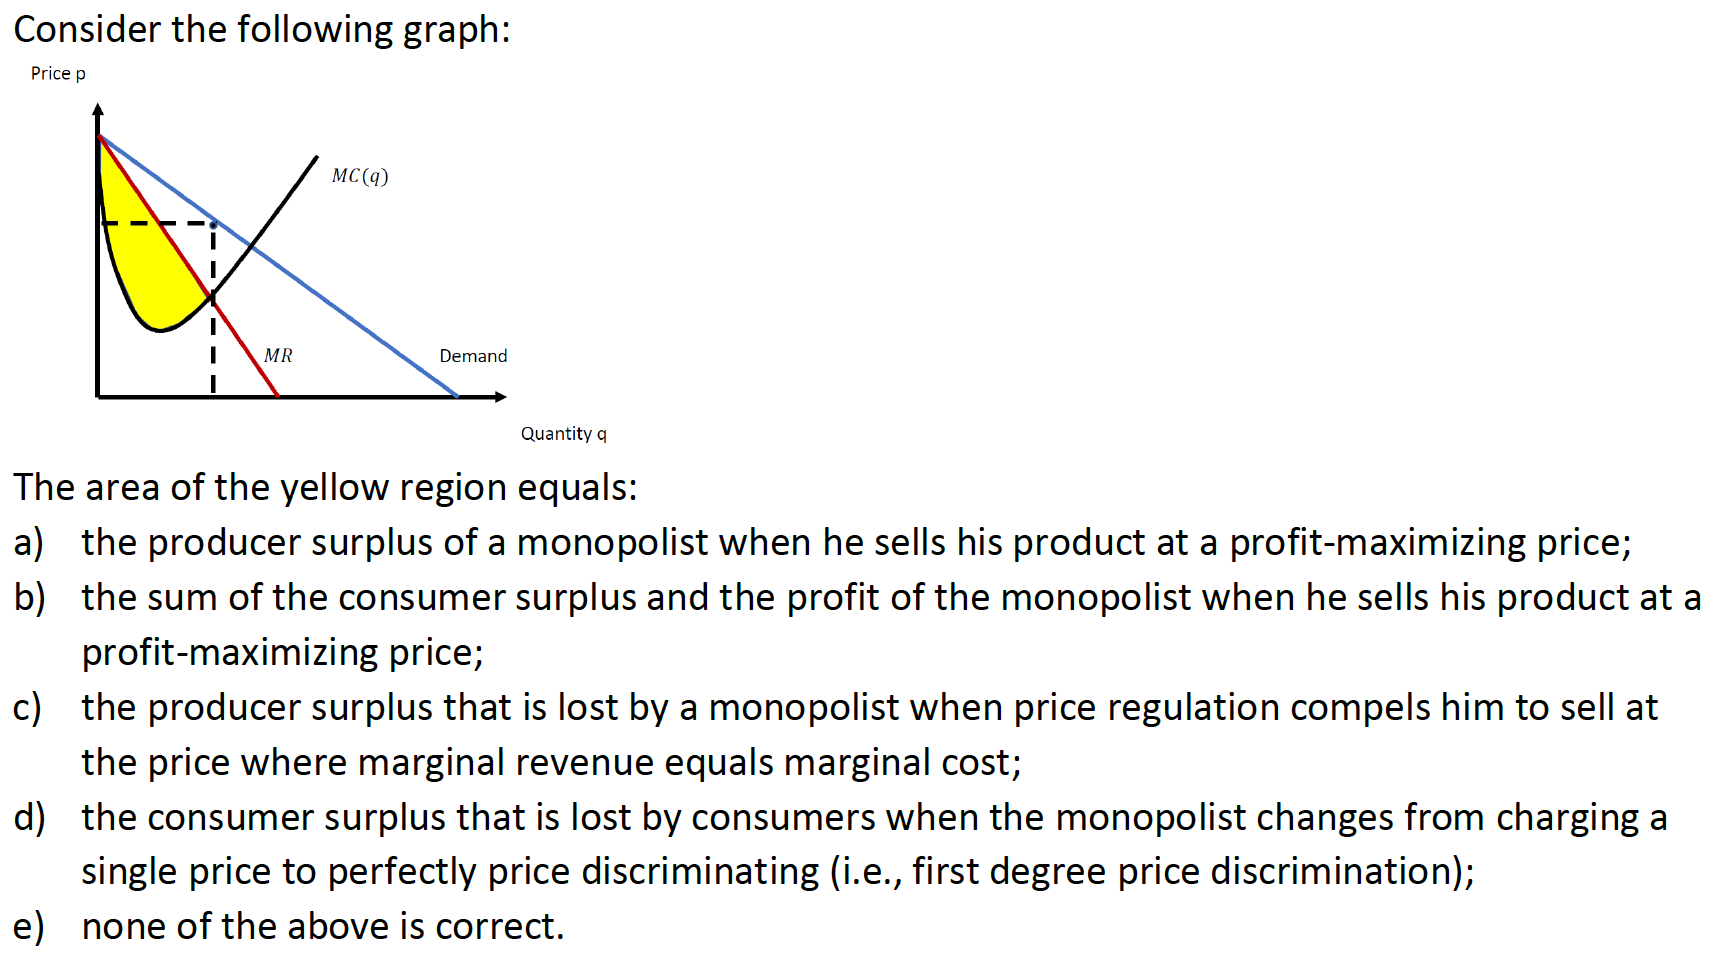
Consider the following graph: Price p M50?) Demand Quantitvq The area of the yellow region equals: a) the producer surplus of a monopolist when he sells his product at a profit-maximizing price; b) the sum of the consumer surplus and the profit of the monopolist when he sells his product at a profit-maximizing price; c) the producer surplus that is lost by a monopolist when price regulation compels him to sell at the price where marginal revenue equals marginal cost; d) the consumer surplus that is lost by consumers when the monopolist changes from charging a single price to perfectly price discriminating (i.e., first degree price discrimination); e) none of the above is correct
Step by Step Solution
There are 3 Steps involved in it

Get step-by-step solutions from verified subject matter experts