

Question: this is a presentation for clients regarding the term structure of interest rates.??The shape of the term structure of interest rates is often used to
this is a presentation for clients regarding the term structure of interest rates.??The shape of the term structure of interest rates is often used to predict future macroeconomic conditions as wells as the course of future short-term interest rates.??this spreadsheet that contains mid-year, Constant-Maturity and Zero-Coupon yields from 2006 - 2022.
Given info:
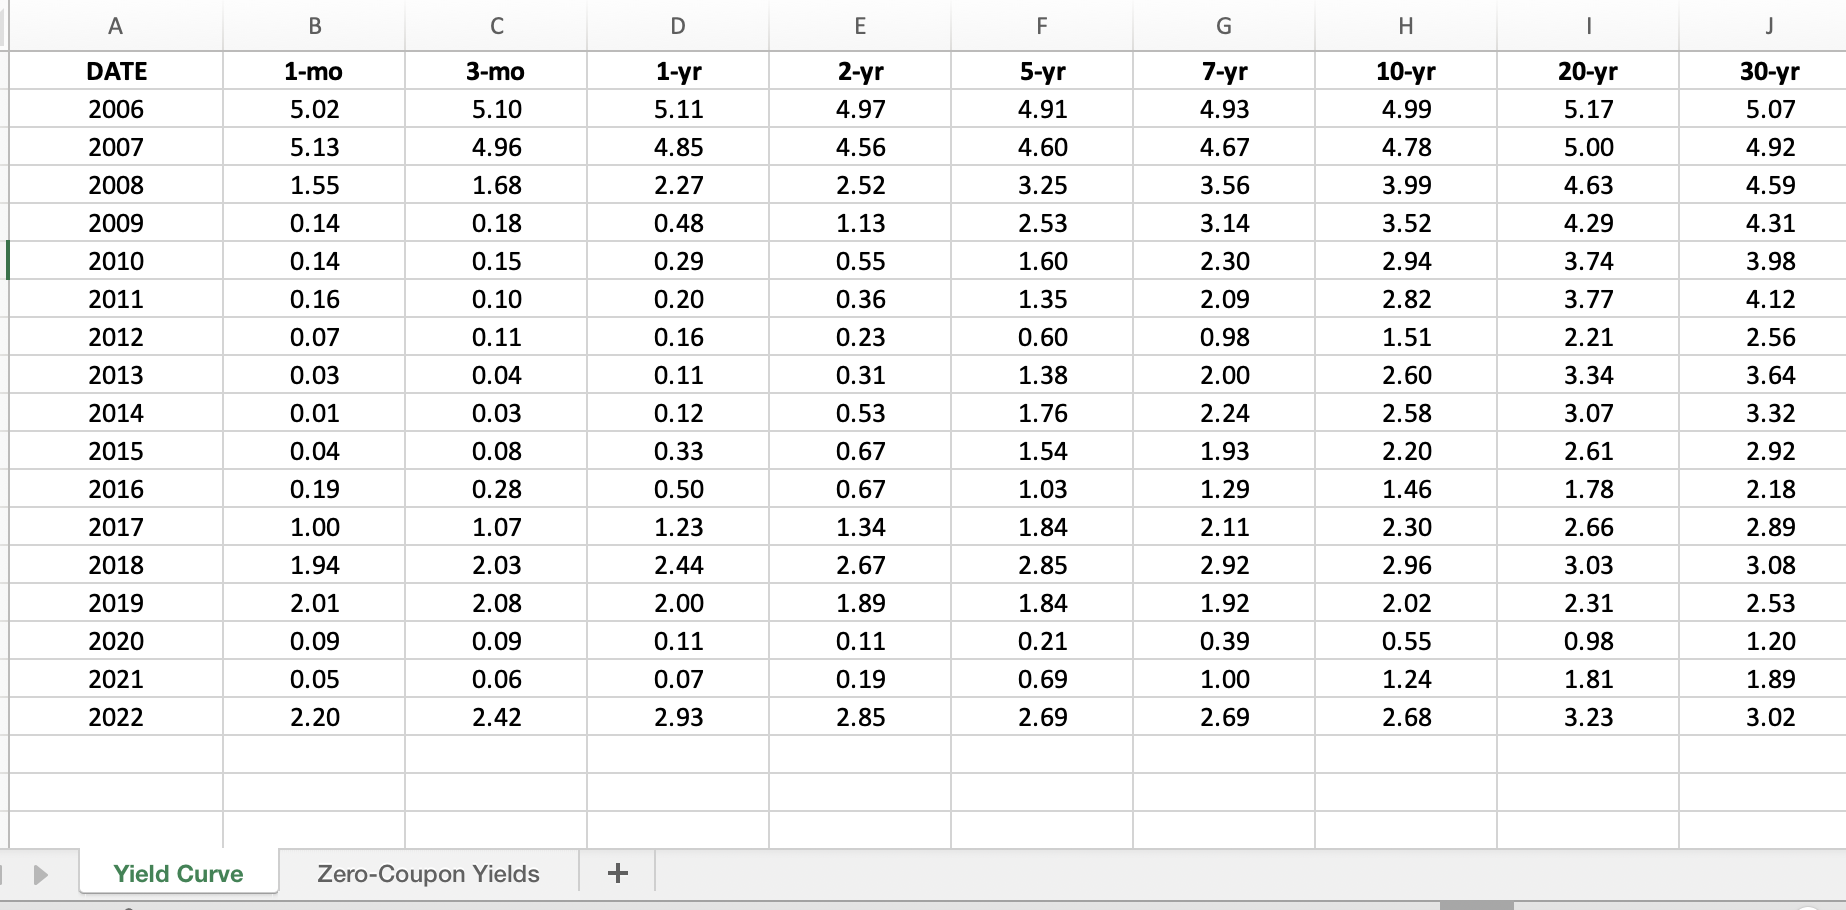
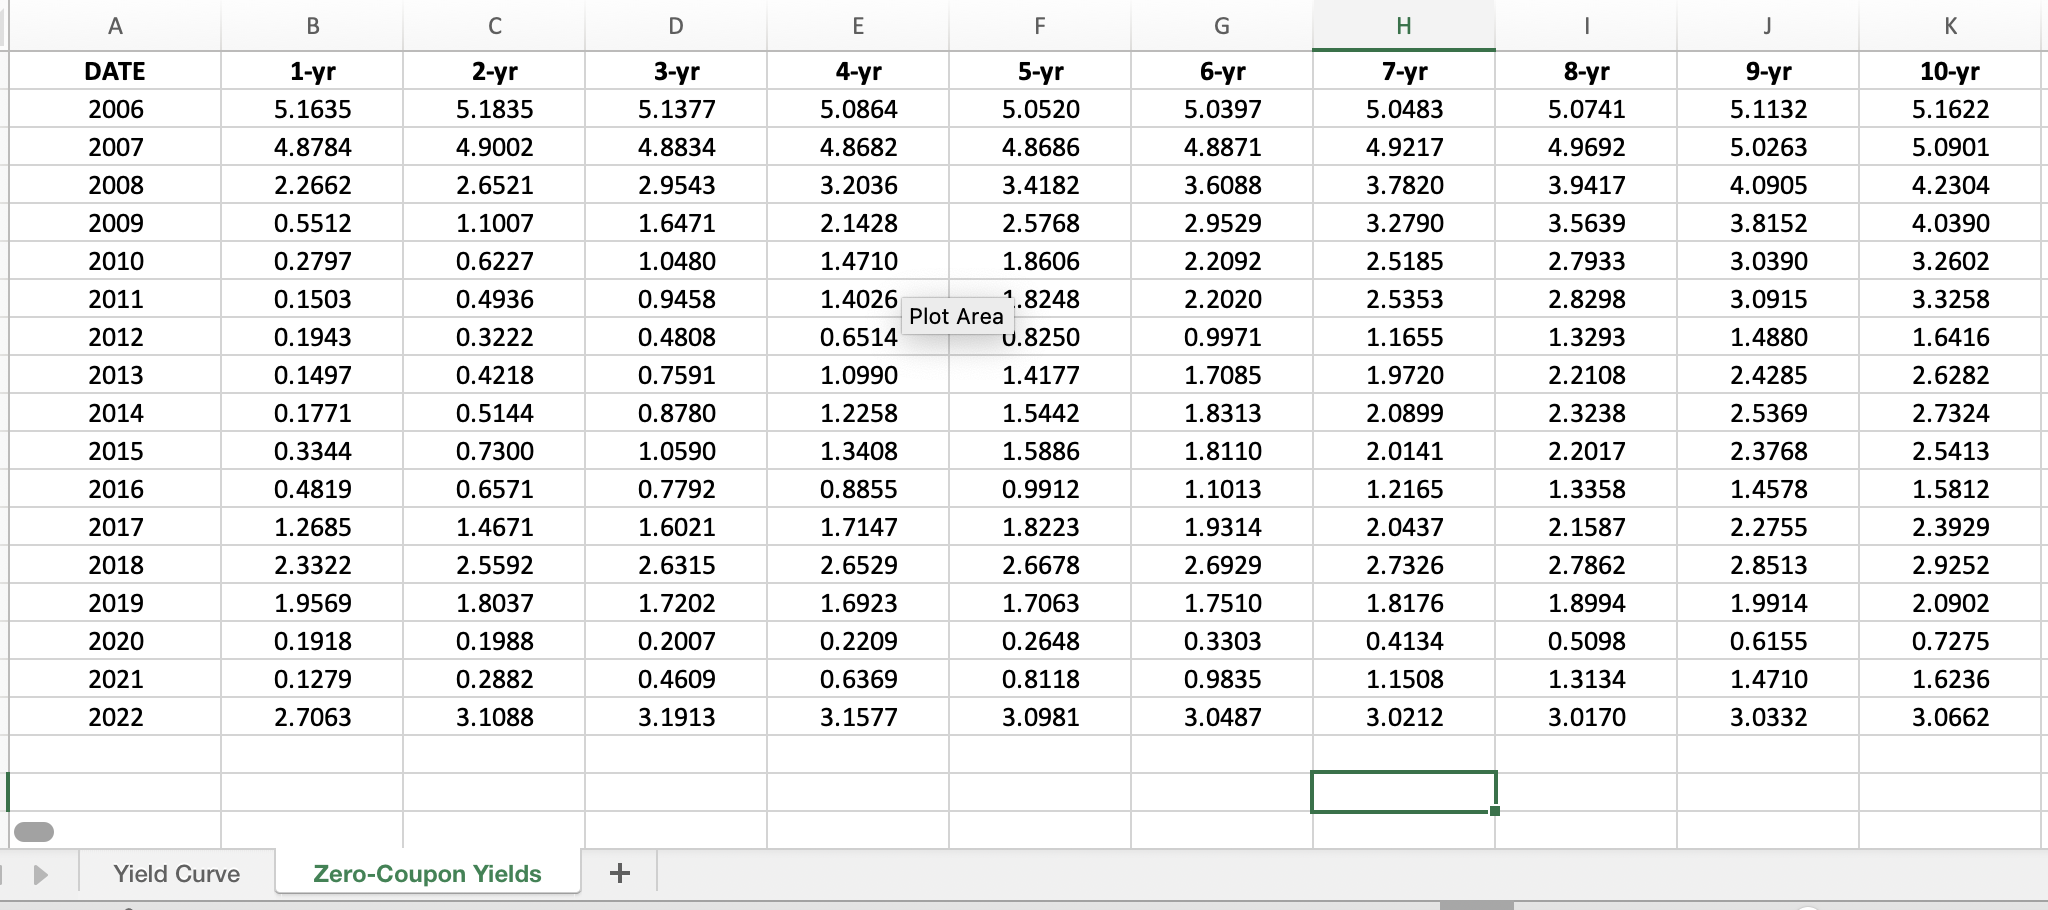
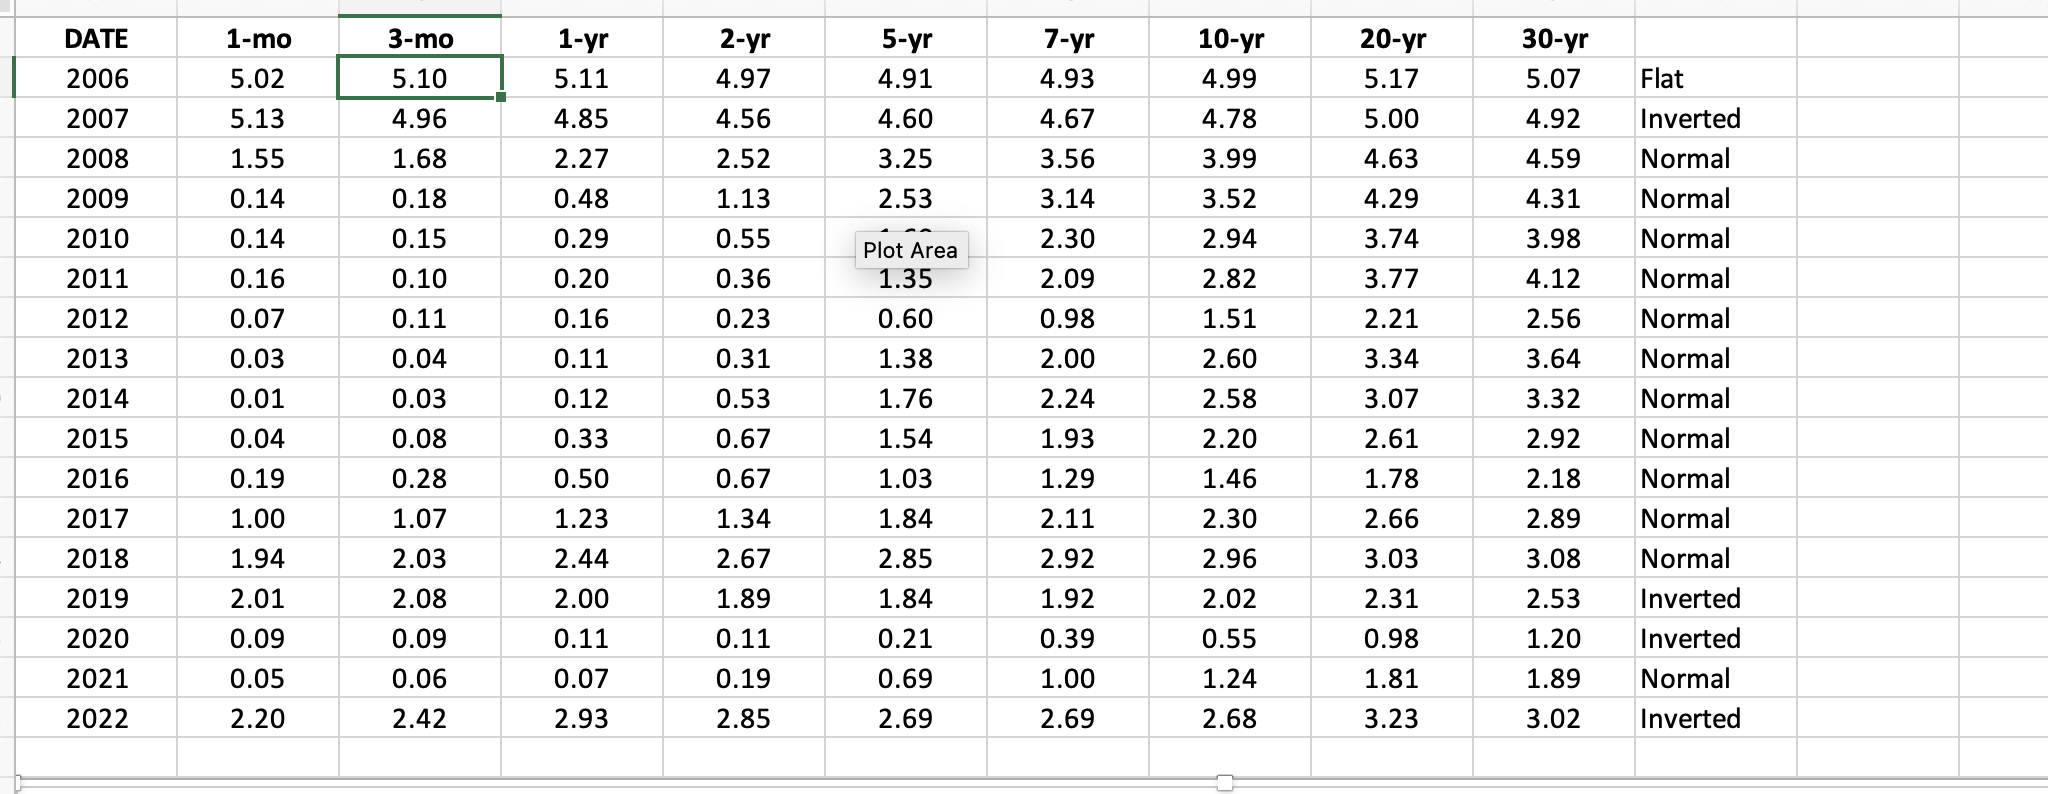
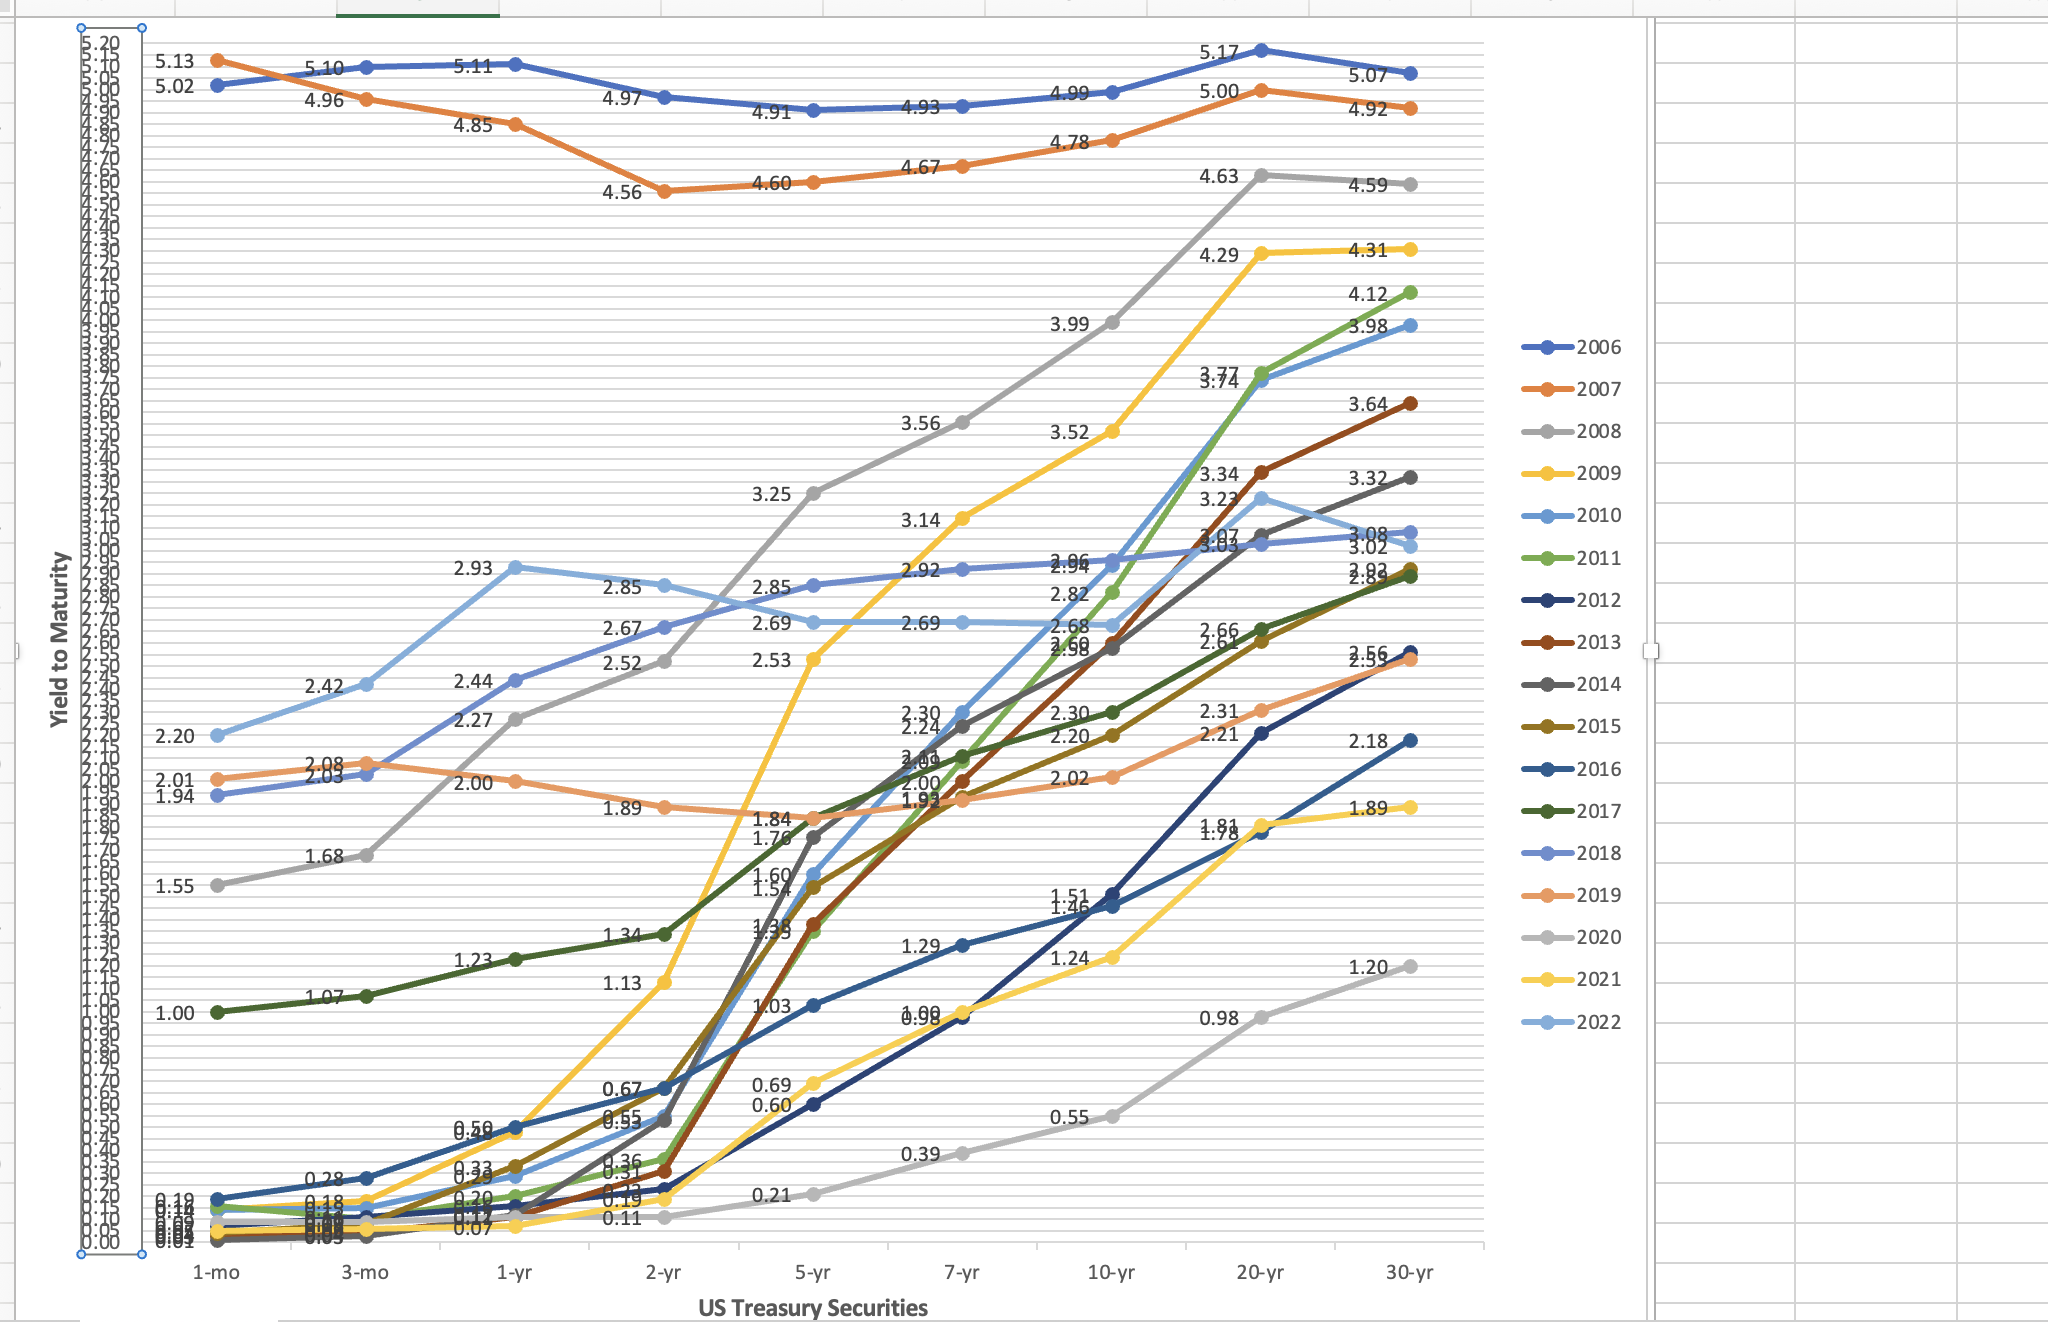
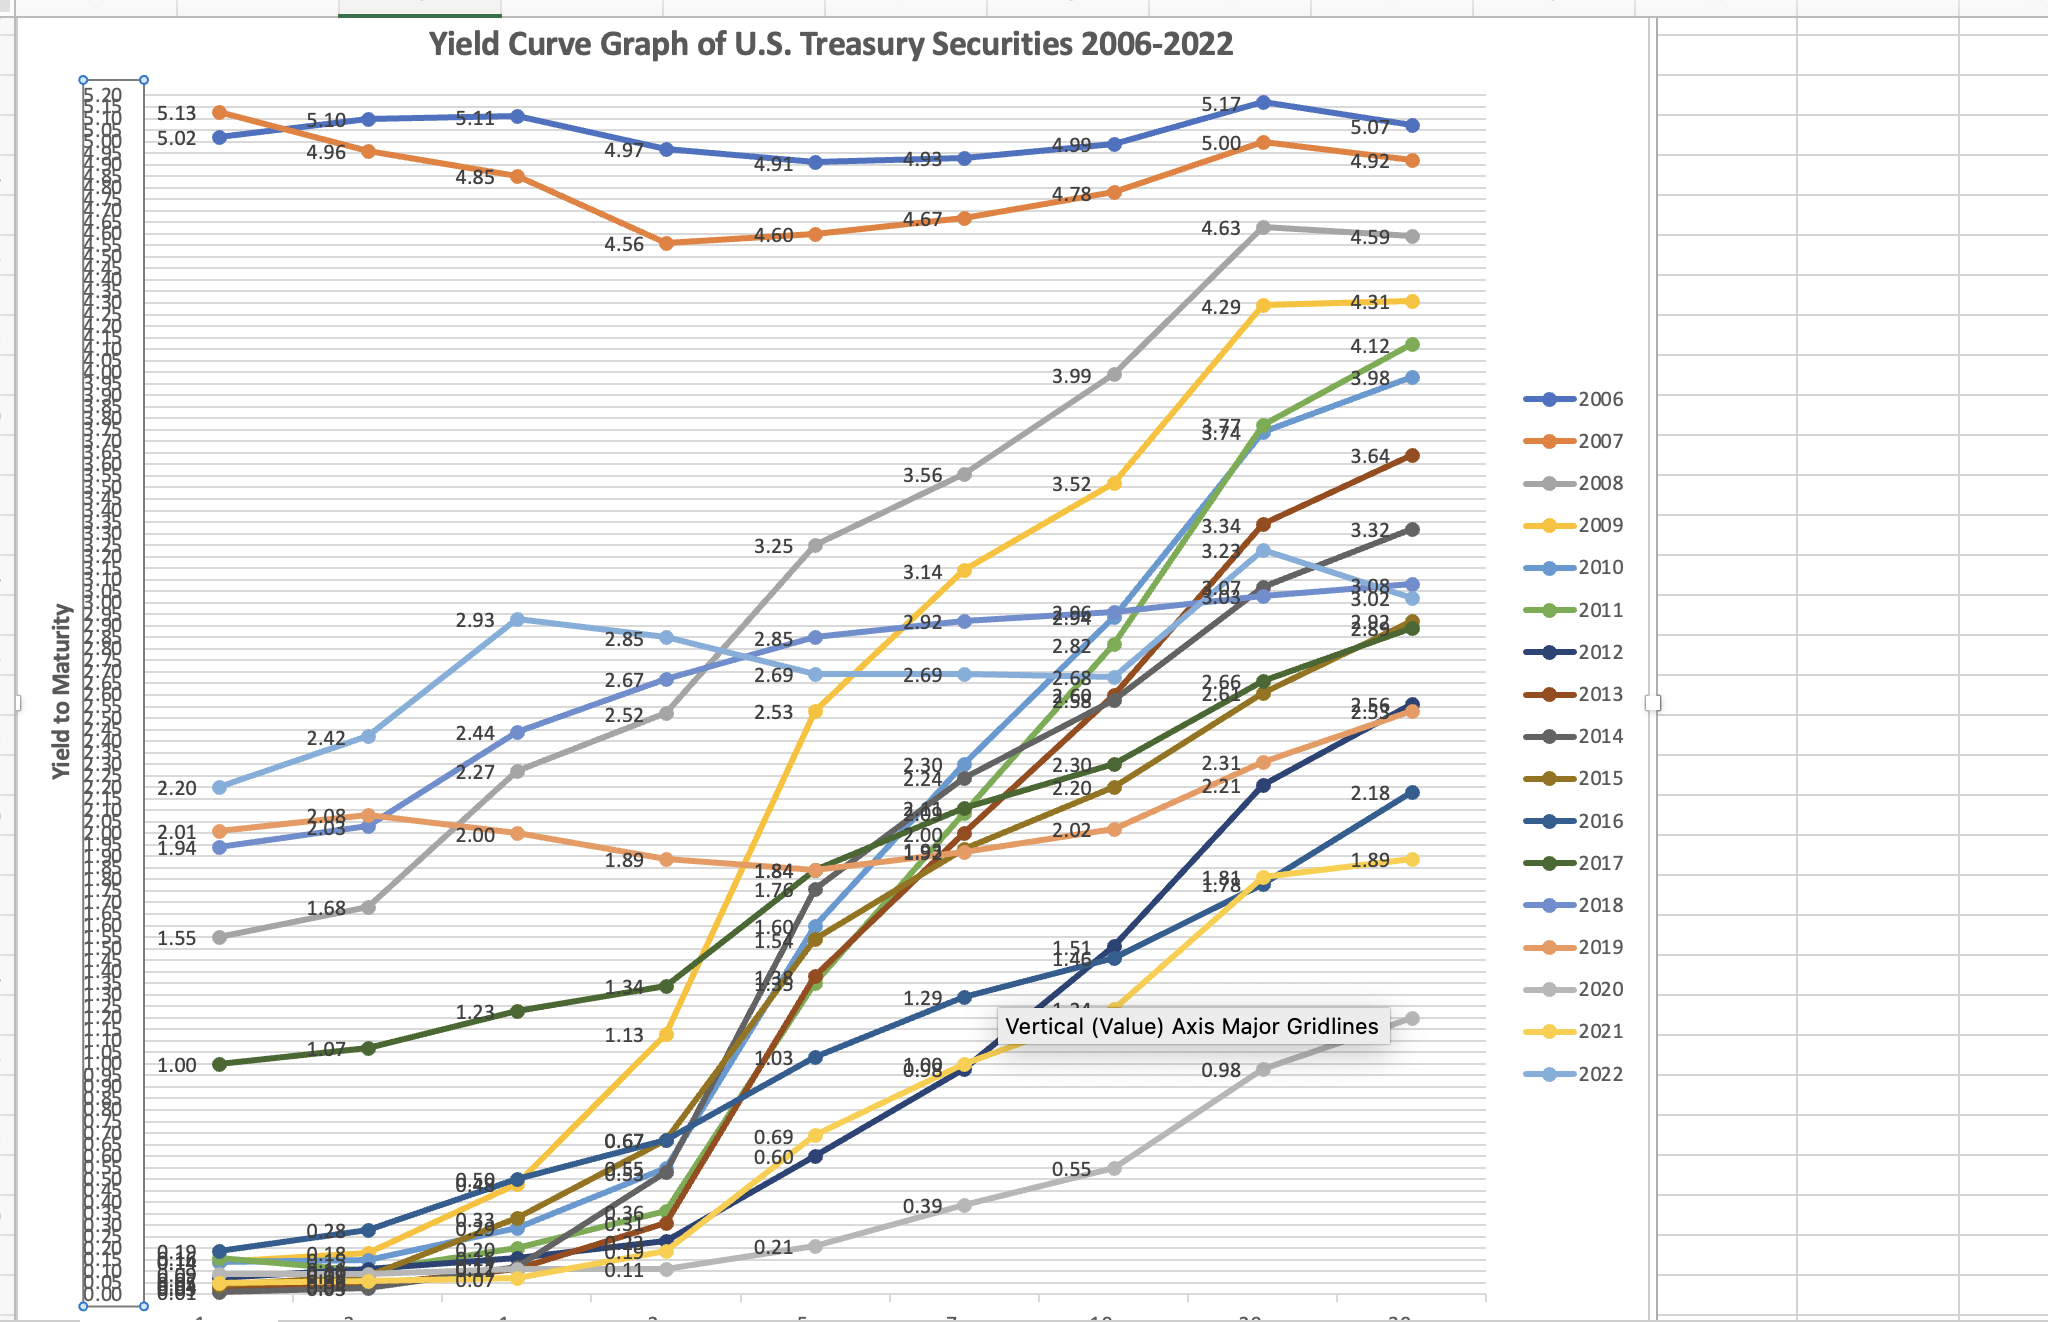
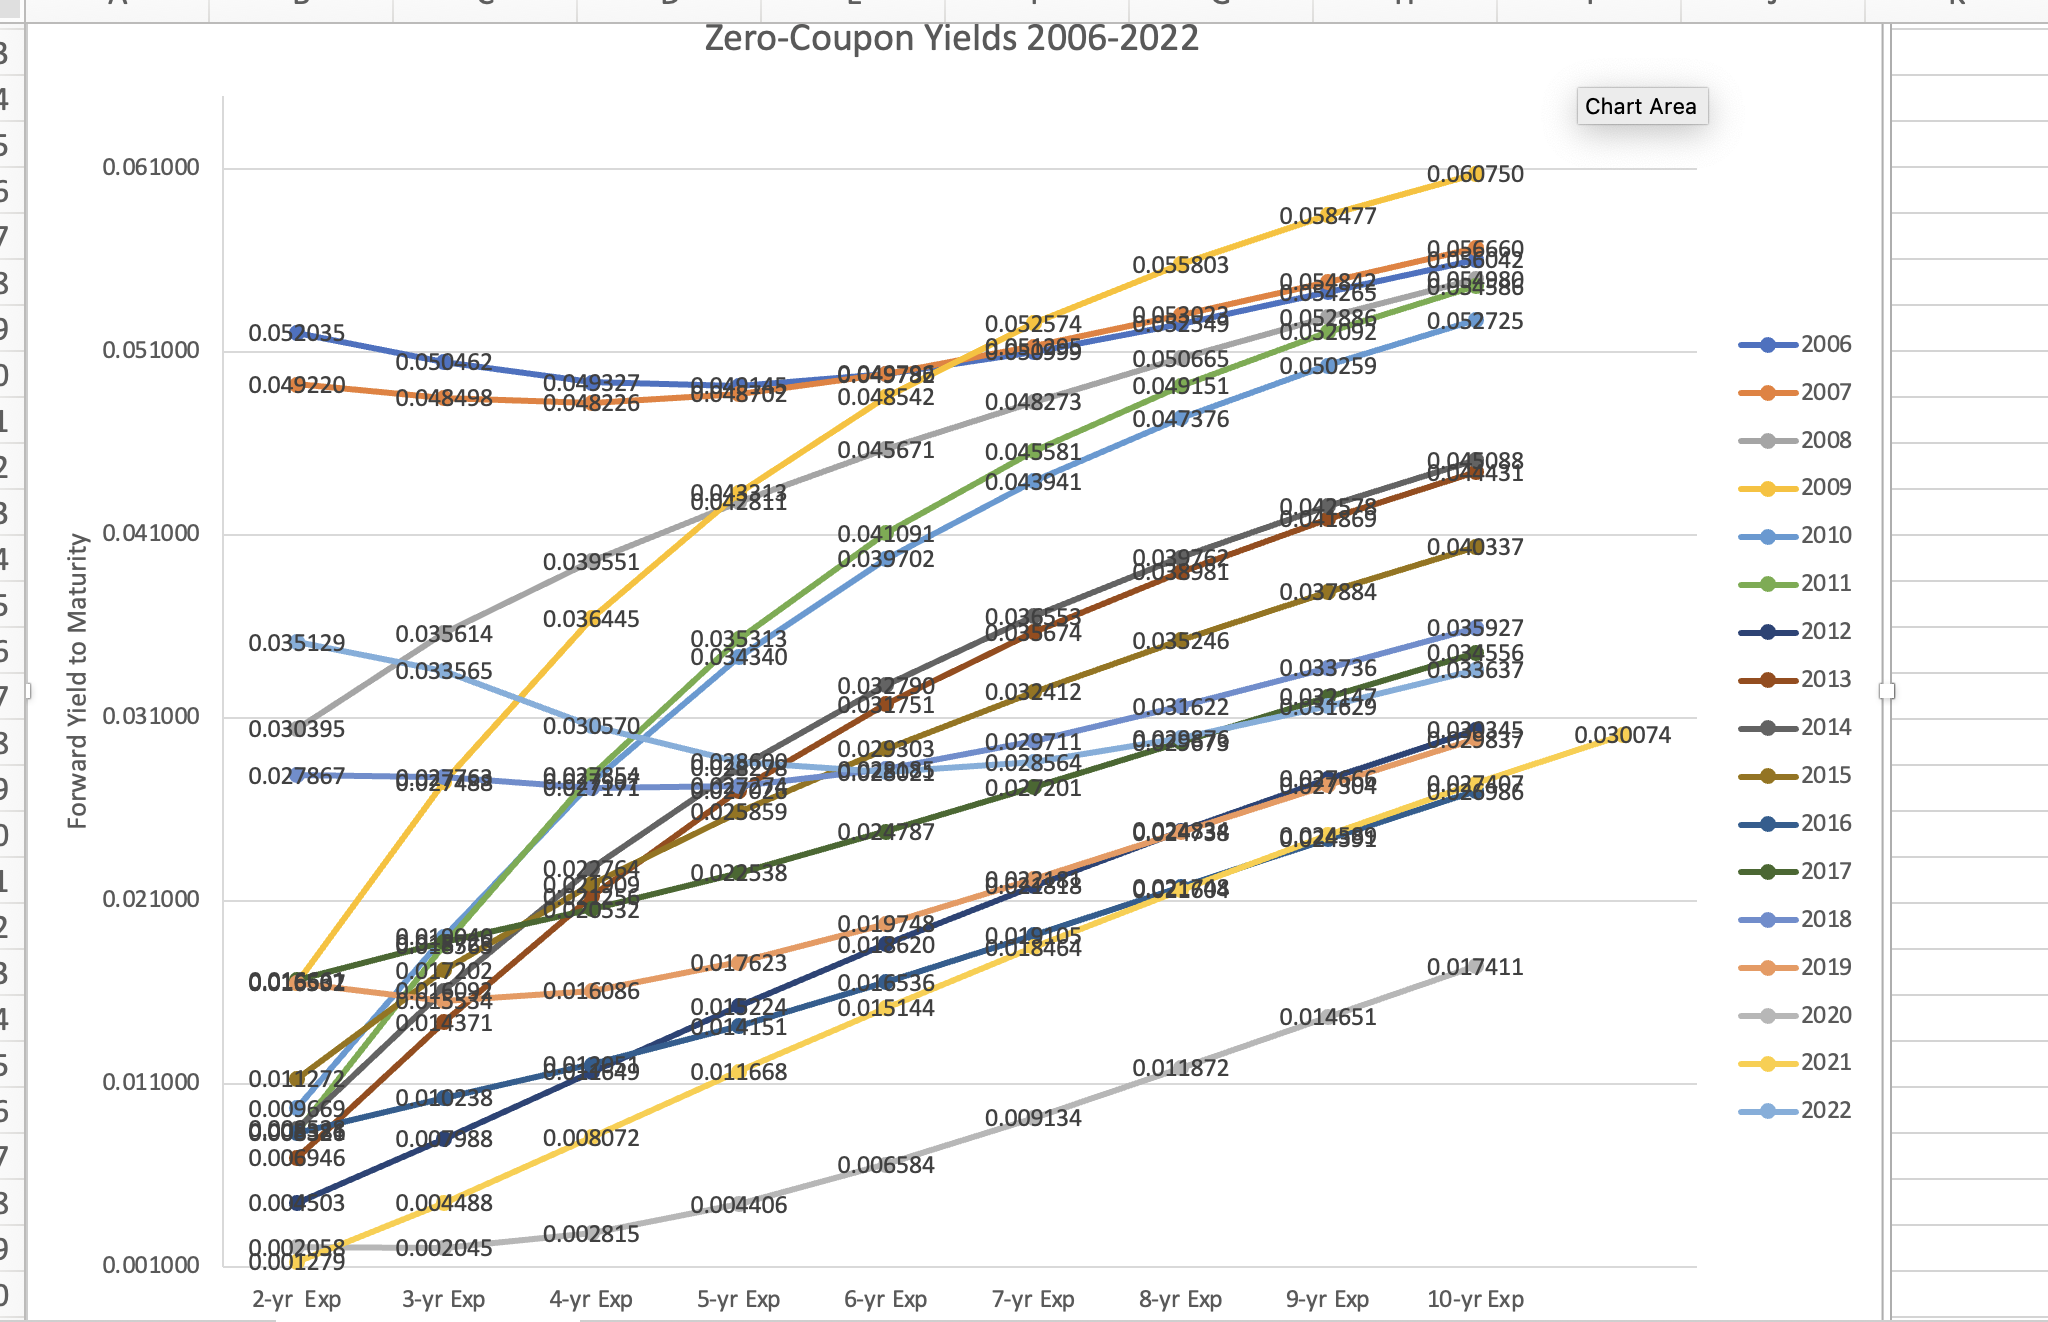
A B C D E F G H DATE 1-mo 3-mo 1-yr 2-yr 5-yr 7-yr 10-yr 20-yr 30-yr 2006 5.02 5.10 5.11 4.97 4.91 4.93 4.99 5.17 5.07 2007 5.13 4.96 4.85 4.56 4.60 4.67 4.78 5.00 4.92 2008 1.55 1.68 2.27 2.52 3.25 3.56 3.99 4.63 4.59 2009 0.14 0.18 0.48 1.13 2.53 3.14 3.52 4.29 4.31 2010 0.14 0.15 0.29 0.55 1.60 2.30 2.94 3.74 3.98 2011 0.16 0.10 0.20 0.36 1.35 2.09 2.82 3.77 4.12 2012 0.07 0.11 0.16 0.23 0.60 0.98 1.51 2.21 2.56 2013 0.03 0.04 0.11 0.31 1.38 2.00 2.60 3.34 3.64 2014 0.01 0.03 0.12 0.53 1.76 2.24 2.58 3.07 3.32 2015 0.04 0.08 0.33 0.67 1.54 1.93 2.20 2.61 2.92 2016 0.19 0.28 0.50 0.67 1.03 1.29 1.46 1.78 2.18 2017 1.00 1.07 1.23 1.34 1.84 2.11 2.30 2.66 2.89 2018 1.94 2.03 2.44 2.67 2.85 2.92 2.96 3.03 3.08 2019 2.01 2.08 2.00 1.89 1.84 1.92 2.02 2.31 2.53 2020 0.09 0.09 0.11 0.11 0.21 0.39 0.55 0.98 1.20 2021 0.05 0.06 0.07 0.19 0.69 1.00 1.24 1.81 1.89 2022 2.20 2.42 2.93 2.85 2.69 2.69 2.68 3.23 3.02 Yield Curve Zero-Coupon Yields +A B C D E F G H K DATE 1-yr 2-yr 3-yr 4-yr 5-yr 6-yr 7-yr 8-yr 9-yr 10-yr 2006 5.1635 5.1835 5.1377 5.0864 5.0520 5.0397 5.0483 5.0741 5.1132 5.1622 2007 4.8784 4.9002 4.8834 4.8682 4.8686 4.8871 4.9217 4.9692 5.0263 5.0901 2008 2.2662 2.6521 2.9543 3.2036 3.4182 3.6088 3.7820 3.9417 4.0905 4.2304 2009 0.5512 1.1007 1.6471 2.1428 2.5768 2.9529 3.2790 3.5639 3.8152 4.0390 2010 0.2797 0.6227 1.0480 1.4710 1.8606 2.2092 2.5185 2.7933 3.0390 3.2602 2011 0.1503 0.4936 0.9458 1.4026 1.8248 2.2020 2.5353 Plot Area 2.8298 3.0915 3.3258 2012 0.1943 0.3222 0.4808 0.6514 U.8250 0.9971 1.1655 1.3293 1.4880 1.6416 2013 0.1497 0.4218 0.7591 1.0990 1.4177 1.7085 1.9720 2.2108 2.4285 2.6282 2014 0.1771 0.5144 0.8780 1.2258 1.5442 1.8313 2.0899 2.3238 2.5369 2.7324 2015 0.3344 0.7300 1.0590 1.3408 1.5886 1.8110 2.0141 2.2017 2.3768 2.5413 2016 0.4819 0.6571 0.7792 0.8855 0.9912 1.1013 1.2165 1.3358 1.4578 1.5812 2017 1.2685 1.4671 1.6021 1.7147 1.8223 1.9314 2.0437 2.1587 2.2755 2.3929 2018 2.3322 2.5592 2.6315 2.6529 2.6678 2.6929 2.7326 2.7862 2.8513 2.9252 2019 1.9569 1.8037 1.7202 1.6923 1.7063 1.7510 1.8176 1.8994 1.9914 2.0902 2020 0.1918 0.1988 0.2007 0.2209 0.2648 0.3303 0.4134 0.5098 0.6155 0.7275 2021 0.1279 0.2882 0.4609 0.6369 0.8118 0.9835 1.1508 1.3134 1.4710 1.6236 2022 2.7063 3.1088 3.1913 3.1577 3.0981 3.0487 3.0212 3.0170 3.0332 3.0662 Yield Curve Zero-Coupon Yields +DATE 1-mo 3-mo 1-yr 2-yr 5-yr 7-yr 10-yr 20-yr 30-yr 2006 5.02 5.10 5.11 4.97 4.91 4.93 4.99 5.17 5.07 Flat 2007 5.13 4.96 4.85 4.56 4.60 4.67 4.78 5.00 4.92 Inverted 2008 1.55 1.68 2.27 2.52 3.25 3.56 3.99 4.63 4.59 Normal 2009 0.14 0.18 0.48 1.13 2.53 3.14 3.52 4.29 4.31 Normal 2010 0.14 0.15 0.29 0.55 Plot Area 2.30 2.94 3.74 3.98 Normal 2011 0.16 0.10 0.20 0.36 1.35 2.09 2.82 3.77 4.12 Normal 2012 0.07 0.11 0.16 0.23 0.60 0.98 1.51 2.21 2.56 Normal 2013 0.03 0.04 0.11 0.31 1.38 2.00 2.60 3.34 3.64 Normal 2014 0.01 0.03 0.12 0.53 1.76 2.24 2.58 3.07 3.32 Normal 2015 0.04 0.08 0.33 0.67 1.54 1.93 2.20 2.61 2.92 Normal 2016 0.19 0.28 0.50 0.67 1.03 1.29 1.46 1.78 2.18 Normal 2017 1.00 1.07 1.23 1.34 1.84 2.11 2.30 2.66 2.89 Normal 2018 1.94 2.03 2.44 2.67 2.85 2.92 2.96 3.03 3.08 Normal 2019 2.01 2.08 2.00 1.89 1.84 1.92 2.02 2.31 2.53 Inverted 2020 0.09 0.09 0.11 0.11 0.21 0.39 0.55 0.98 1.20 Inverted 2021 0.05 0.06 0.07 0.19 0.69 1.00 1.24 1.81 1.89 Normal 2022 2.20 2.42 2.93 2.85 2.69 2.69 2.68 3.23 3.02 Inverted5.13 5.02 5.10 5.41 0 4.96 5.17 4.97 4.85 4.91 4.93 4.99 5.00 5.07 4.92 4.78 4.56 4.60 4.67 4.63 4.59 4.29 4.31 4.12 3.99 3.98 3:74 2006 3.56 3.64 2007 3.52 -2008 3.25 3.34 3.32 3.14 3.23 2009 2.93 -2010 2.85 2.85 2.92 2.96 3:02 2:83 -2011 Yield to Maturity 2.82 2.67 2.69 2.69 2012 2.42 2.44 2.52 2.53 2.6 3-66 2:56 2013 2.20 2.27 3:38 2.30 2.31 2014 2:89 2.20 2.21 2.00 2.18 2015 1.89 2.02 2016 1.84 1.68 1 70 1.89 1:98 2017 1.55 1:50 -2018 1 34 -2019 1.23 1.29 107 1.13 1.24 -2020 1.00 1/03 1.20 8:98 -2021 0.98 2022 0.67 0.69 0.50 9:55 0.60 0.55 029 8-32 0.39 0-18 0.20 0.19 0.21 0.11 1-mo 3-mo 1-yr 2-yr 5-yr 7-yr 10-yr 20-yr US Treasury Securities 30-yrYield to Maturity 2.20 1.55 I . ,... Yield Curve Graph of U.S. Treasury Securities 2006-2022 4.29 4'31 4.1 3.99 .9. 431 3.6 3.5.152 2.18 1.89 an..- Vertical (Value) Axis Major Gridlines '0 *2036 +2037 #2038 2039 +2010 +2011 *2012 +2013 +2014 +2015 +2016 *2017 +2018 +2019 +2020 2021 +2022 Zero-Coupon Yields 2006-2022 Chart Area 0. 061000 0.060750 0.058477 0.055803 8 856 659 8-854842 8-054986 0.052035 0.052574 8-053929 8-852886 0. 05 1000 0.052725 0.050462 0.050999 2006 0.049220 0.049327 8:848702 0.049786 0.050665 0.050259 0.048498 0.048226 0.048542 0.048273 0.049151 -2007 0.047376 0.045671 0.045581 2008 8:843313 0.043941 0.042528 2009 0. 041000 0.041091 0.04 1869 0.039551 0.039702 0.040337 2010 8981 0.037884 -2011 0.035614 0.036445 8.036553 0.035129 8-835313 0.035674 0.035246 0.035927 2012 Forward Yield to Maturity 0.033565 0.032790 0.033736 0.034556 0.033637 0. 03 1000 9031751 0.032412 -2013 0.030395 0.030570 0.031622 9 034623 0.029303 0.029711 0.029879 8 029835 0.030074 2014 0.027867 0:027468 0:027951 8:028290 0.0 7074 0.028095 0.028564 0 027201 8.027904 -2015 0 025859 0 024787 0.024838 0.024592 2016 8.8326 0 022538 0.021000 1909 0.022398 0.021608 -2017 1532 0.019749 0.010620 8.018464 2018 0.016582 9,017202 0.017623 0.016086 0 016536 0.017411 -2019 9.014371 0.013224 0.015144 0 014151 0.014651 -2020 0.01 1000 0.01 272 2849 0.011668 0.011872 -2021 0.009669 0 010238 0.008326 0.00 988 0.009134 2022 0.006946 0.008072 0.006584 0.00 503 0.004488 0.004406 8:882958 0.002045 0.002815 0. 001000 2-yr Exp 3-yr Exp 4-yr Exp 5-yr Exp 6-yr Exp 7-yr Exp 8-yr Exp 9-yr Exp 10-yr Exp
Step by Step Solution
There are 3 Steps involved in it

Get step-by-step solutions from verified subject matter experts