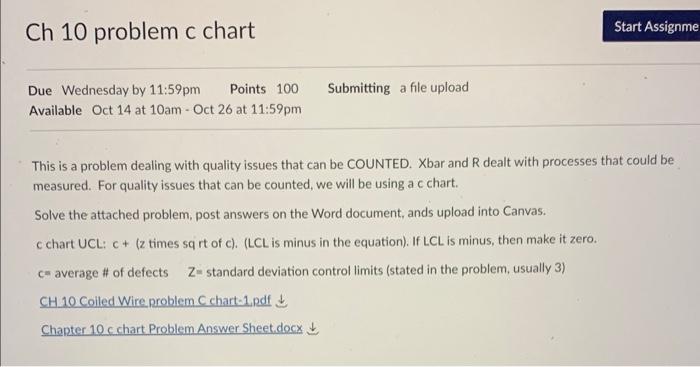
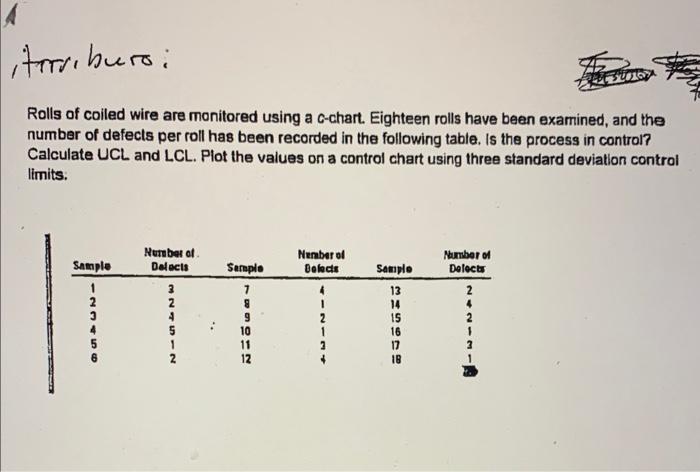
Question: This is a problem dealing with quality issues that can be COUNTED. Xbar and R dealt with processes that could be measured. For quality issues

This is a problem dealing with quality issues
This is a problem dealing with quality issues that can be COUNTED. Xbar and R dealt with processes that could be measured. For quality issues that can be counted, we will be using a c chart. Solve the attached problem, post answers on the Word document, ands upload into Canvas. c chart UCL: c+ ( z times sq it of c ). (LCL is minus in the equation). If LCL is minus, then make it zero. c= average # of defects Z= standard deviation control limits (stated in the problem, usually 3) CH10 Coiled Wire problem C chart-1, pdf Chapter 10 c chart Problem Answer Sheetdocx Rolls of coiled wire are monitored using a c-chart. Eighteen rolls have been examined, and the number of defects per roll has been recorded in the following table. Is the process in control? Calculate UCL and LCL. Plot the values on a control chart using three standard deviation control limits: UCL C Show calculation: LCL c Show calculation

Step by Step Solution

There are 3 Steps involved in it

1 Expert Approved Answer
Step: 1 Unlock blur-text-image
Question Has Been Solved by an Expert!

Get step-by-step solutions from verified subject matter experts

Step: 2 Unlock
Step: 3 Unlock

Students Have Also Explored These Related General Management Questions!