

Question: This is a project! Thank you :) aleu s MATH 145 Project for Unit 1 USED CAR PRICES' DUE DATE: This project is worth
This is a project! Thank you :)
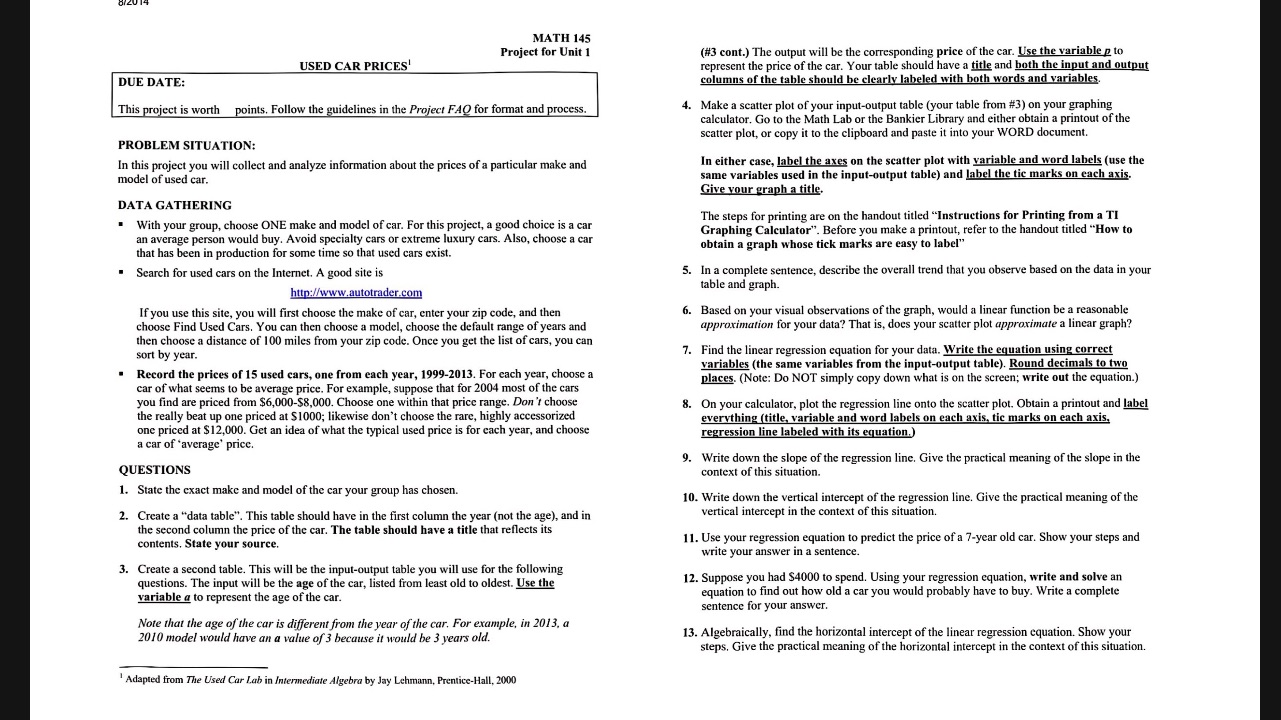
aleu s MATH 145 Project for Unit 1 USED CAR PRICES' " DUE DATE: This project is worth _points. Follow the guidelines in the Project FAQ for format and process. PROBLEM SITUATION: In this project you will colleet and analyze information about the prices of a particular make and model of used car. DATA GATHERING * With your group, choose ONE make and model of car. For this project, a good choice is a car an average person would buy. Avoid specialty cars or extreme luxury cars. Also, choose a car that has been in production for some time so that used cars exist. = Search for used cars on the Internet. A good site is htpe/fwww autotrader.com 1f you use this site, you will first choose the make of car, enter your zip code, and then choose Find Used Cars. You can then choose a model, choose the default range of years and then choose a distance of 100 miles from your zip code. Once you get the list of cars, you ean sort by year. = Reeord the prices of 15 used cars, one from each year, 1999-2013. For each year, choose a car of what seems to be average price. For example, suppose that for 2004 most of the cars you find are priced from $6,000-58,000. Choose one within that price range. Dan t choose the really beat up one priced at $1000; likewise don't choose the rare, highly accessorized one priced at $12,000. Get an idea of what the typical used price is for cach year, and choose a car of 'average' price. QUESTIONS 1. State the cxact make and model of the car your group has chosen. 2, Create a \"data table\". This table should have in the first column the year {not the age), and in the second column the price of the car. The table should have a title that reflects its contents. State your source, 3. Create a second table. This will be the input-output table you will use for the following questions. The input will be the age of the car, listed from least old to oldest. Use the variable a to represent the age of the car. Note that the age of the car is different from the year of the car. For example, in 2013, a 2010 model would have an a value of 3 because it would be 3 years old. ! Adapted from The Used Car Lak in Intermediate Algebra by Jay Lehmann, Prentice-Hall, 2000 (#3 cont.) The output will be the corresponding price of the car. Use the variable p 1o represent the price of the car. Your table should have a title and both the input and outpug columns of the table should be clearly labeled both words and variables. 4. Make a scatter plot of your input-output table (your table from #3) on your graphing caleulator, Go to the Math Lab or the Bankier Library and either obtain a printout of the scatter plot, or copy it to the clipboard and paste it into your WORD document. In either case, label the axes on the scatter plot with variable and word labels (use the same variables used in the input-output table) and |abel the tic marks on each axis Give vour graph a title. The steps for printing are on the handout titled \"Instructions for Printing from a TI Graphing Caleulator\". Before you make a printout, refer to the handout titled \"How to obtain a graph whose tick marks arc casy to label\" 5. Ina complete sentence, describe the overall trend that you observe based on the data in your table and graph. 6. Based on your visual observations of the graph, would a linear function be a reasonable approximation for your data? That is, does your scatter plot approximate a linear graph? 7. Find the linear regression equation for your data. Write the equation using correct variables (the same variables from the input-output table). Round decimals to twao places. (Note: Do NOT simply copy down what is on the screen: write out the equation.) 8. On your calculator, plot the regression line onto the scatter plot. Obtain a printout and label evervthing (title, variable and word labels on each axis, tic marks on each axis, ession line labeled with i ation 9, Write down the slope of the regression line, Give the practical meaning of the slope in the context of this situation. 10. Write down the vertical intercept of the regressi vertical intercept in the context of this situation. line. Give the practical meaning of the 11. Use your regression equation to predict the price of a 7-year old car. Show your steps and wrile your answer in a sentence. 12. Suppose you had $4000 to spend. Using your regression equation, write and solve an equation to find out how old a car you would probably have to buy. Write a complete sentence for your answer. 13. Algebraically, find the horizontal intercept of the linear regression equation. Show your steps. Give the practical meaning of the horizontal intercept in the context of this situation
Step by Step Solution
There are 3 Steps involved in it

Get step-by-step solutions from verified subject matter experts