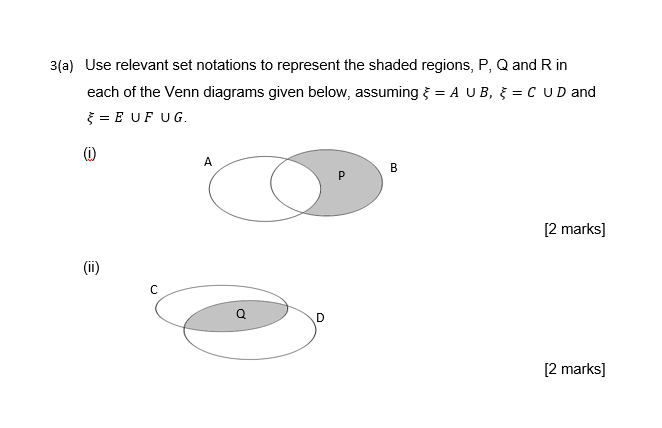
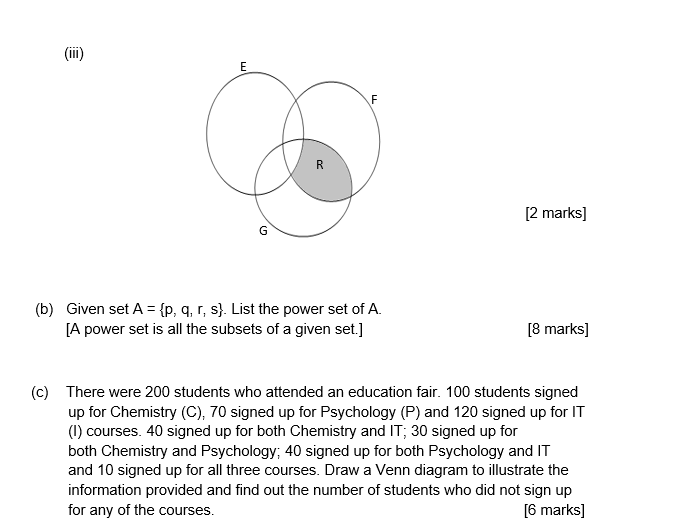
Question: This is a question 3(a) Use relevant set notations to represent the shaded regions: P: Q and R in each of the Venn diagrams given

This is a question

This is a question 3(a) Use relevant setThis is a question 3(a) Use relevant setThis is a question 3(a) Use relevant set
3(a) Use relevant set notations to represent the shaded regions: P: Q and R in each of the Venn diagrams given below, assuming 6 = A U E, I: = E u D and :zsusus {j} [2 marks] W [2 marks] (iii) E F R [2 marks] G (b) Given set A = {p, q, r, s}. List the power set of A. [A power set is all the subsets of a given set.] [8 marks] (c) There were 200 students who attended an education fair. 100 students signed up for Chemistry (C), 70 signed up for Psychology (P) and 120 signed up for IT (I) courses. 40 signed up for both Chemistry and IT; 30 signed up for both Chemistry and Psychology; 40 signed up for both Psychology and IT and 10 signed up for all three courses. Draw a Venn diagram to illustrate the information provided and find out the number of students who did not sign up for any of the courses. [6 marks]4. The data below is the test scores of 60 students. 72 56 48 49 77 68 58 80 52 83 59 60 58 88 50 72 68 50 46 78 58 69 70 62 68 50 49 60 77 68 62 50 54 63 76 81 90 74 48 57 72 90 73 82 74 62 66 71 76 65 58 47 60 72 80 60 70 62 59 68 Contract a stem-and-leaf chart for the data above. [4 marks] Determine the median of the data. [2 marks] Construct a frequency table with the help of the Table below: [2 marks] Class Frequency 40 - 49 6 50 -59 14 60 -69 17 70 -79 15 80 - 89 6 90 -99 2 State the median class. [2 marks] (v) Find the median of the grouped data. [4 marks] Find the mean of the grouped data. [6 marks]

Step by Step Solution

There are 3 Steps involved in it

1 Expert Approved Answer
Step: 1 Unlock blur-text-image
Question Has Been Solved by an Expert!

Get step-by-step solutions from verified subject matter experts

Step: 2 Unlock
Step: 3 Unlock

Students Have Also Explored These Related Mathematics Questions!