

Question: this is a question for a bioinformatician and this project is done utilizing GALAXY . I have this assignment which I have done up until
this is a question for a bioinformatician and this project is done utilizing GALAXY. I have this assignment which I have done up until step 4 and I can not figure out the how to move forward and how to create DESeq2 files. To be honest I don't get the bigger picture of this assignment and what each step actually means. Even up until the 4th step I am not sure if I have done it correctly because I have been following instructions without really understanding what I am actually seeing or analyzing and what each step does in reality. I would VERY MUCH appreciate it if someone could please please or help we go on from step 4 ( and what prerequisites so that everything can work) and please please explain to me a bit the bigger picture of this project etc. or please just tell me the starting steps because I am not even sure about the one that I have done. or please refer me to a link or something to learn. thank you very much in advance.
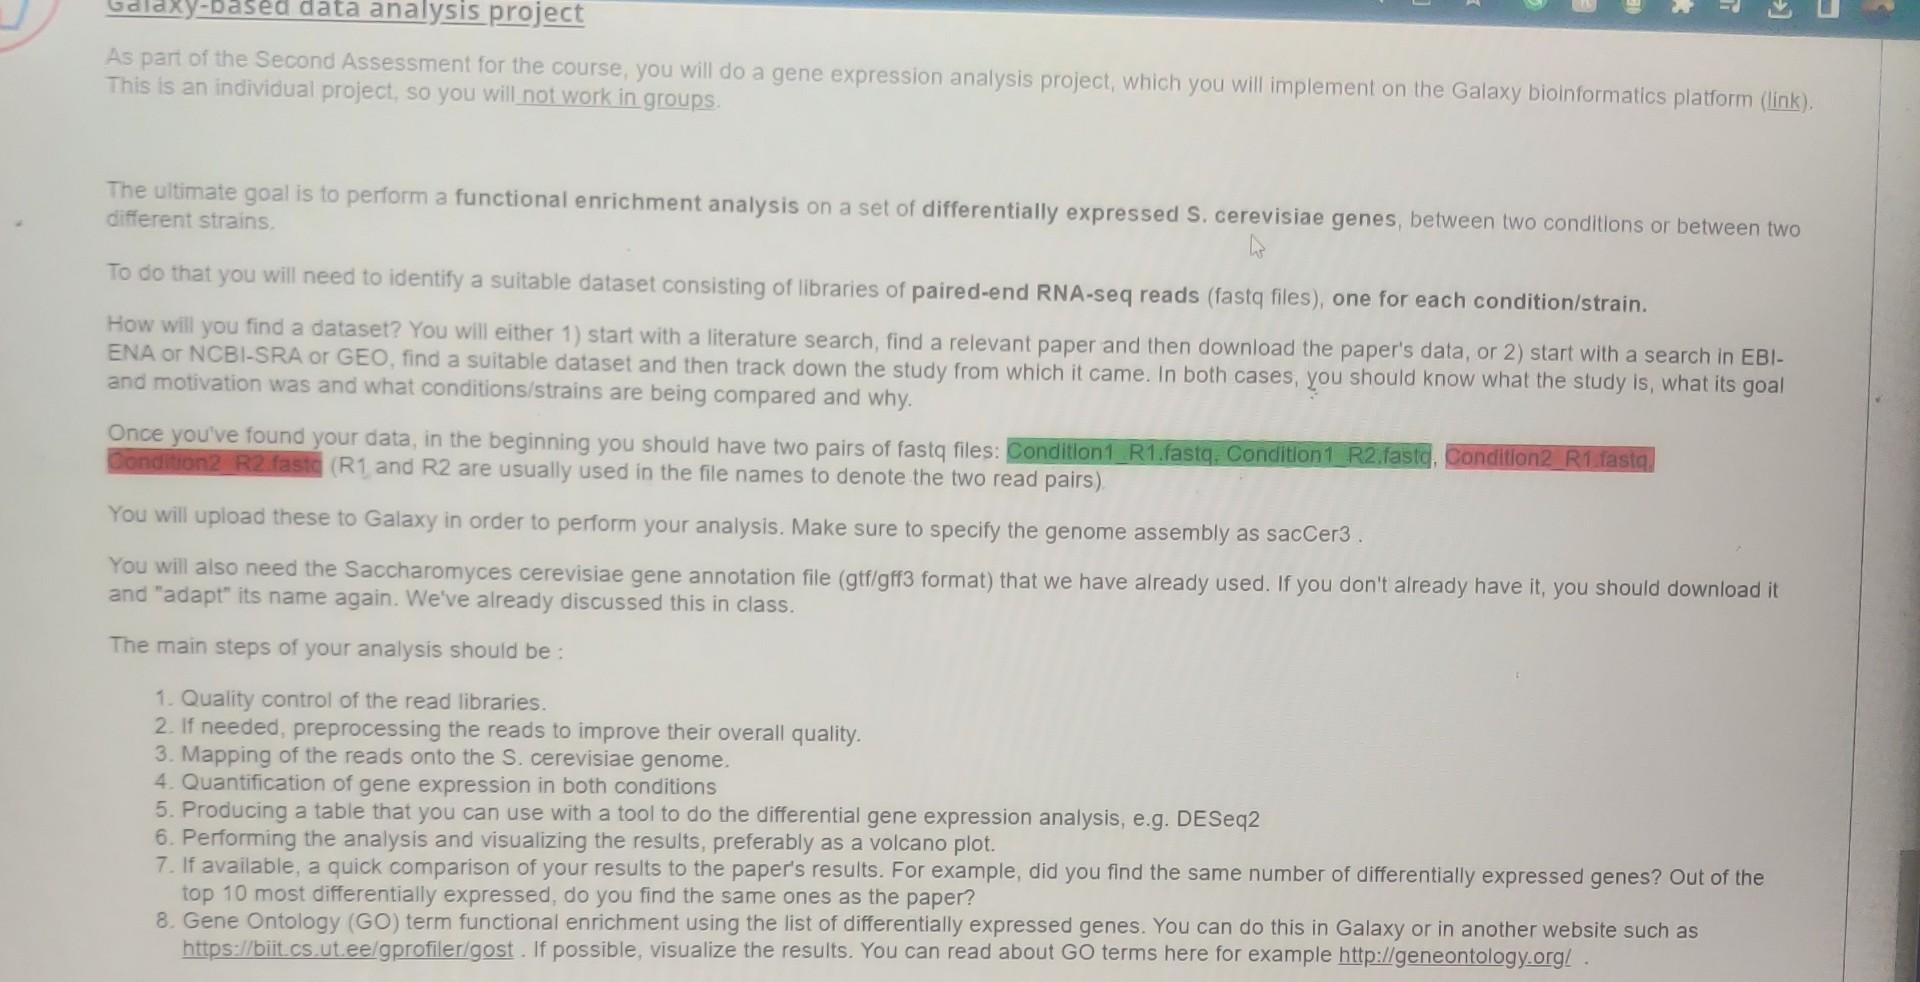
As part of the Second Assessment for the course, you will do a gene expression analysis project, which you will implement on the Galaxy bioinformatics platform (link). This is an individual project, so you will not work in groups. The ultimate goal is to perform a functional enrichment analysis on a set of differentially expressed S. cerevisiae genes, between two conditions or between two different strains. To do that you will need to identify a suitable dataset consisting of libraries of paired-end RNA-seq reads (fastq files), one for each condition/strain. How will you find a dataset? You will either 1) start with a literature search, find a relevant paper and then download the paper's data, or 2 ) start with a search in EBIENA or NCBI-SRA or GEO, find a suitable dataset and then track down the study from which it came. In both cases, you should know what the study is, what its goal and motivation was and what conditions/strains are being compared and why. Once you've found your data, in the beginning you should have two pairs of fastq files: Condition1_R1.fastq, Condition1 R2,fastd. Condition2 R2 fastc (R1 and R2 are usually used in the file names to denote the two read pairs) You will upload these to Galaxy in order to perform your analysis. Make sure to specify the genome assembly as sacCer3 . You will also need the Saccharomyces cerevisiae gene annotation file (gtf/gff3 format) that we have already used. If you don't already have it, you should download it and "adapt" its name again. We've already discussed this in class. The main steps of your analysis should be : 1. Quality control of the read libraries. 2. If needed, preprocessing the reads to improve their overall quality. 3. Mapping of the reads onto the S. cerevisiae genome. 4. Quantification of gene expression in both conditions 5. Producing a table that you can use with a tool to do the differential gene expression analysis, e.g. DESeq2 6. Performing the analysis and visualizing the results, preferably as a volcano plot. 7. If available, a quick comparison of your results to the paper's results. For example, did you find the same number of differentially expressed genes? Out of the top 10 most differentially expressed, do you find the same ones as the paper? 8. Gene Ontology (GO) term functional enrichment using the list of differentially expressed genes. You can do this in Galaxy or in another website such as https://biit.cs. ut.ee/gprofiler/gost. If possible, visualize the results. You can read about GO terms here for example http://geneontology.orgl
Step by Step Solution
There are 3 Steps involved in it

Get step-by-step solutions from verified subject matter experts