

Question: This is a R studio problem. Please help me on this question. Thanks! 1 Least absolute deviations regression: a lad() function Your package will have
This is a R studio problem. Please help me on this question. Thanks!
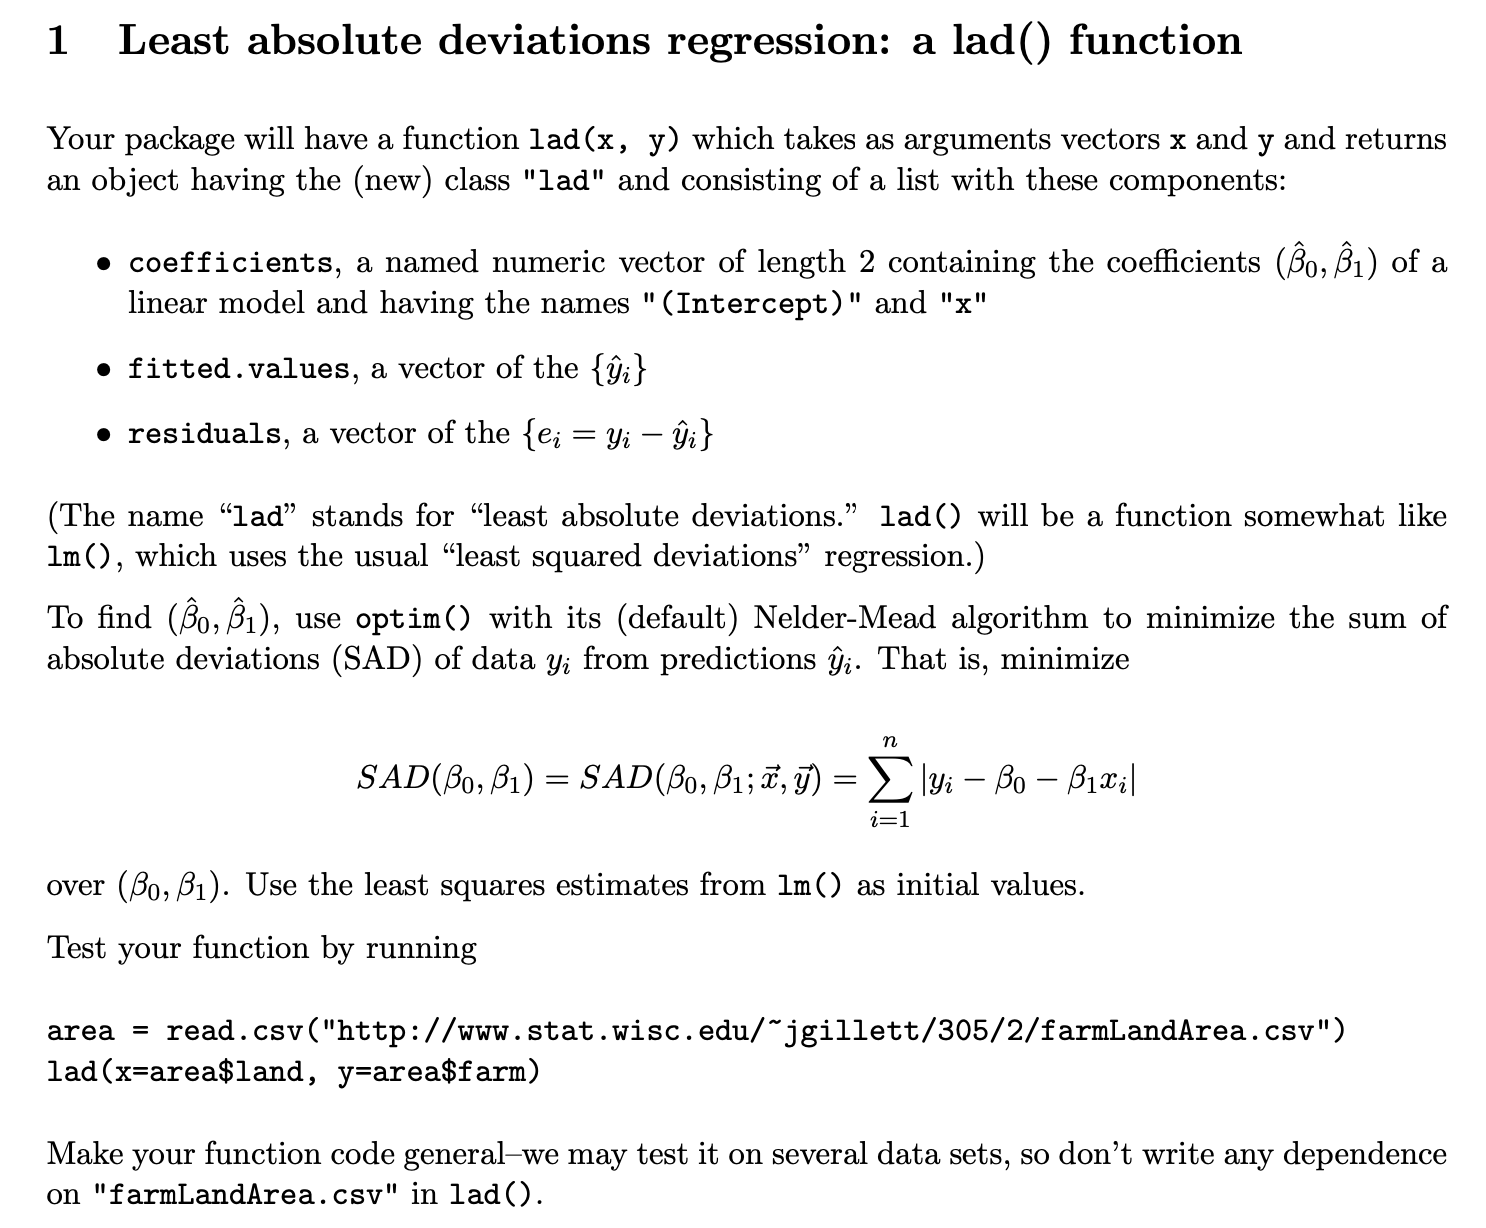
1 Least absolute deviations regression: a lad() function Your package will have a function lad(x, y) which takes as arguments vectors x and y and returns an object having the (new) class "lad" and consisting of a list with these components: 0 coefficients, a named numeric vector of length 2 containing the coeicients (30, 31) of a linear model and having the names " (Intercept) " and "x" o tted.values, a vector of the {332'} o residuals, a vector of the {ad = 313- 333} (The name \"lad\" stands for \"least absolute deviations.\" lad() will be a function somewhat like lm(), which uses the usual \"least squared deviations\" regression.) To nd (80,81), use optimO with its (default) NelderMead algorithm to minimize the sum of absolute deviations (SAD) of data y; from predictions 372-. That is, minimize SAM/30,31) = SAD(Oali1m = Z: lilo: e 51%| i=1 over (60,61). Use the least squares estimates from lm() as initial values. Test your function by running area = read . cst'http://m..ru.1r . stat . wisc . edu/\"j gillett/305/2/farmLandArea. csv ") lad(x=area$land, y=area$farm) Make your function code generalwe may test it on several data sets, so don't write any dependence on \"faImLandArea.csv" in lad()
Step by Step Solution
There are 3 Steps involved in it

Get step-by-step solutions from verified subject matter experts