

Question: This is a Sasa program Question, i need answers 2. Question 2 Use the SAS programfcode EXAM under Question 2 in order to answer the
This is a Sasa program Question, i need answers
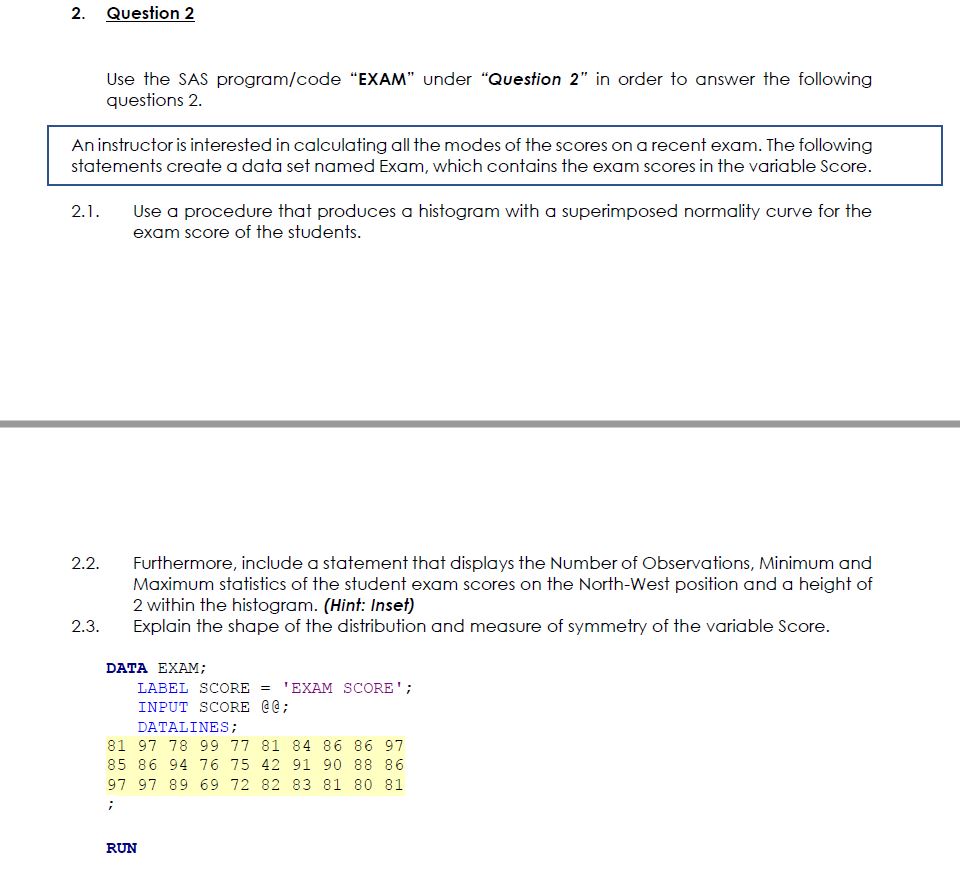
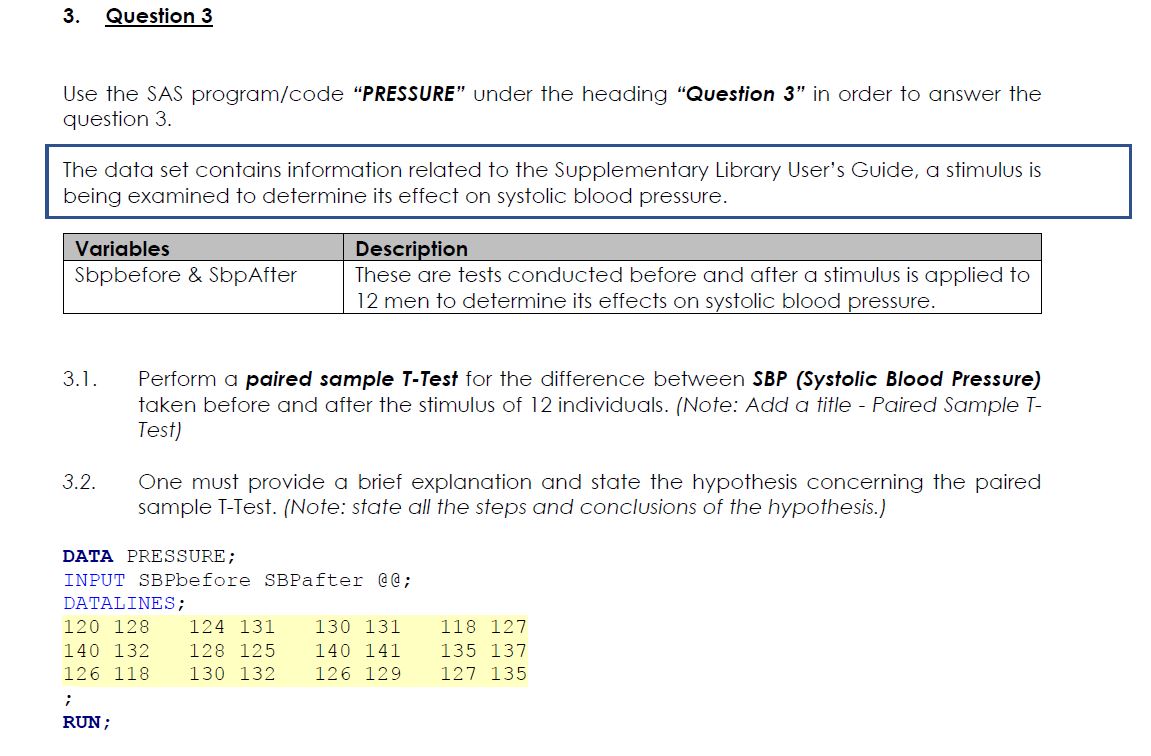
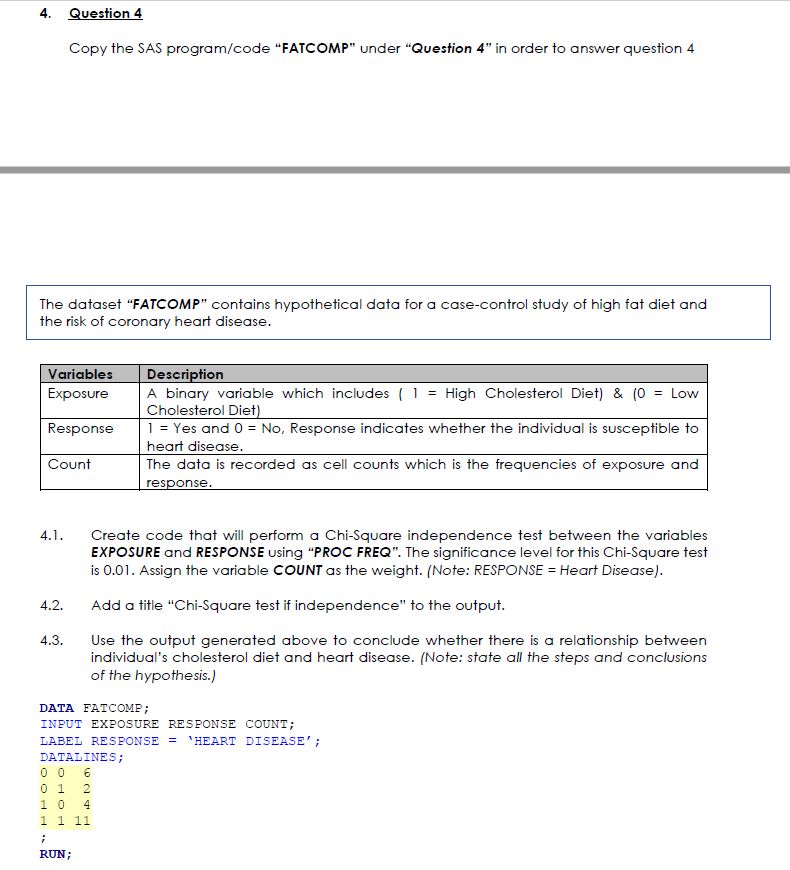
2. Question 2 Use the SAS programfcode "EXAM" under "Question 2" in order to answer the following questions 2. 2.1. Use a procedure that produces a histogram with a superimposed normality curve for the exam score of the students. 2.2. Furthermore, include a statement that displays the Number of Observations, Minimum and Maximum statistics of the student exam scores on the NorthWest position and a height of 2 within the histogram. (Hint: inset) 2.3. Explain the shape of the distribution and measure of symmetry of the variable Score. DATA EXAM; LABEL SCORE = 'EXAM SCORE': INPUT SCORE @6; DATALINES; 31 9? TB 99 T? 81 84 86 86 97 35 86 94 T6 T5 42 91 90 88 86 9? 97 89 69 T2 32 33 81 80 81 r BUN 3. Question 3 Use the SAS programXcode \"PRESSURE" under the heading \"Question 3" in order to answer the question 3. prbefore & prAfter These are tests conducted before and after a stimulus is applied to 12 men to determine its effects on systolic blood pressure. 3.]. Perform a paired sample T-Tesl for the difference between SBP {Systolic Blood Pressure) taken before and after the stimulus of 12 individuals. (Note: Add a title Paired Sample T Test) 3.2. One must provide a brief explanation and state the hypothesis concerning the paired sample TTest. (Note: state all the steps and conclusions of the hypothesis.) DATA PRESSURE; INPUT SBPbefore SBPafter @@: DATALINES: 120 '28 '24 131 130 131 118 127 140 '32 '28 125 140 141 135 137 126 118 130 132 126 129 12? 135 I RUN; 4. Question 4 Copy the SAS program/code "FATCOMP" under "Question 4" in order to answer question 4 The dataset "FATCOMP" contains hypothetical data for a case-control study of high fat diet and the risk of coronary heart disease. Variables Description Exposure A binary variable which includes ( 1 = High Cholesterol Diet) & (0 = Low Cholesterol Diet) Response 1 = Yes and 0 = No, Response indicates whether the individual is susceptible to heart disease. Count The data is recorded as cell counts which is the frequencies of exposure and response. 4.1. Create code that will perform a Chi-Square independence test between the variables EXPOSURE and RESPONSE using "PROC FREQ". The significance level for this Chi-Square test is 0.01. Assign the variable COUNT as the weight. (Note: RESPONSE = Heart Disease). 4.2. Add a title "Chi-Square test if independence" to the output. 4.3. Use the output generated above to conclude whether there is a relationship between individual's cholesterol diet and heart disease. (Note: state all the steps and conclusions of the hypothesis.) DATA FATCOMP; INPUT EXPOSURE RESPONSE COUNT; LABEL RESPONSE = 'HEART DISEASE' ; DATALINES; 0 0 6 0 1 10 1 1 11 RUN
Step by Step Solution
There are 3 Steps involved in it

Get step-by-step solutions from verified subject matter experts