

Question: This is a small research project. As a first step, for 14 selected New York State counties, calculate 2022 household income GINI coefficients. In a
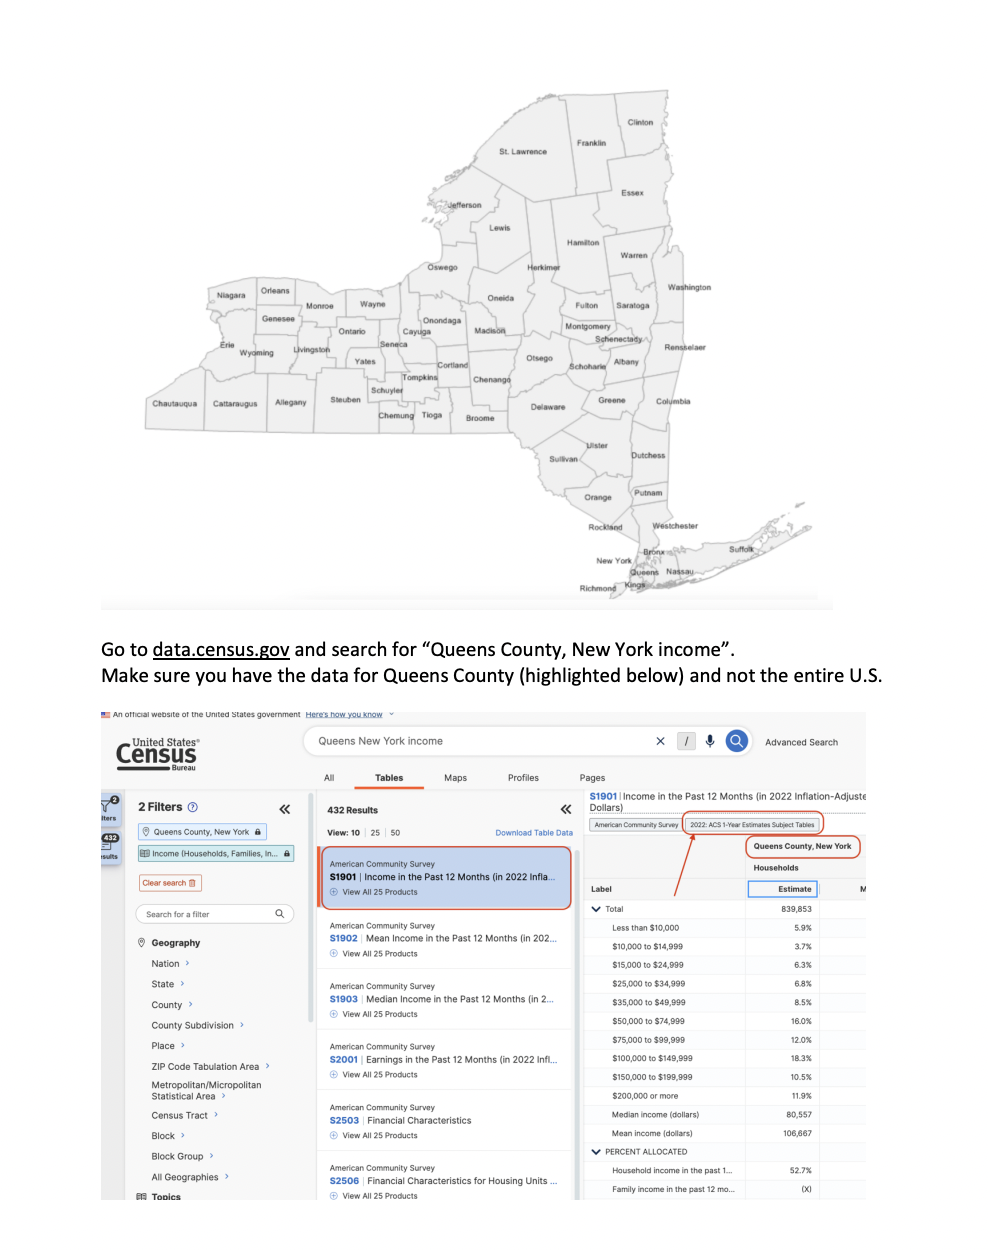
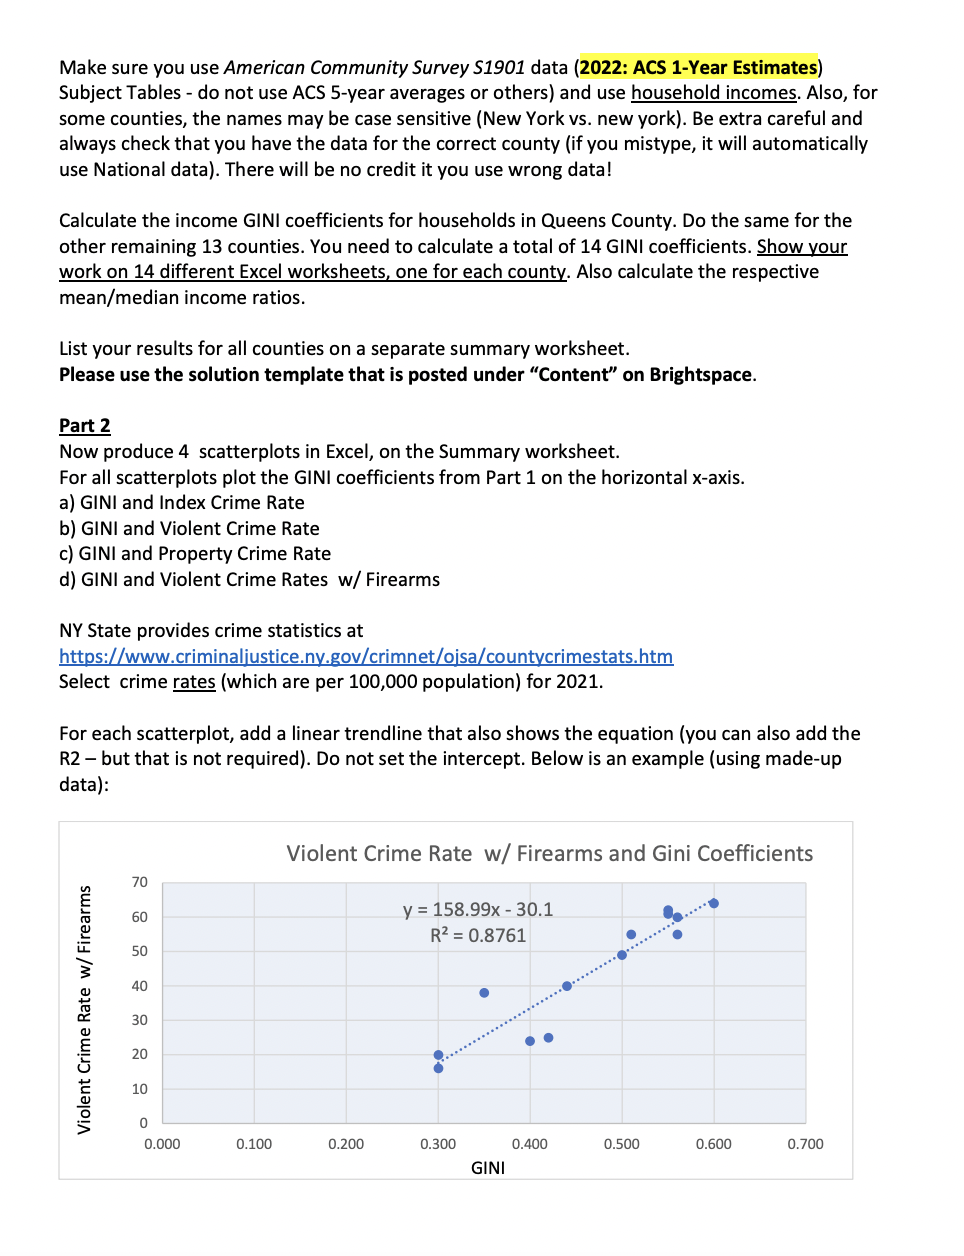
This is a small research project. As a first step, for 14 selected New York State counties, calculate 2022 household income GINI coefficients. In a second step, create four scatterplots in Excel. Each scatterplot shows crime rates (per 100,000 population - see the data link below) on the vertical y-axis and the Gini coefficients (as calculated in the first step) on the horizontal x-axis. The first scatterplot shows the Index Crime Rate, the second the Violent Crime Rate, the third one the Property Crime Rate and the fourth one the Violent Crime Rate with Firearms. Part 1 Compute household income GINI coefficients for 14 New York State counties: (1) Suffolk, (2) Nassau, (3) Queens, (4) Kings (= Brooklyn), (5) Richmond (= Staten Island), (6) New York (= Manhattan), (7) Bronx, (8) Westchester, (9) Rockland, (10) Putnam, (11) Orange, (12) Ulster, (13) Sullivan and (14) Dutchess; all these counties are in or around New York City (see the map below).Clinton Franklin St. Lawrence Essex ZJefferson Lewis Hamilton Warren Niagara Orleans Wayne Oneid Monroe Fulton Saratoga Onondaga Ontario Cayuga Schenectady Livingston Yates Otsego Cortland Scholarin Albany Tompkins Chenango Schuyler Chautauqua Cattaraugus Allegany Greene Delaware Chemung Tioga Broome Ulster Sullivan Dutchess Orange Putmam Westchester Suflow New YorkY Go to data.census.gov and search for "Queens County, New York income". Make sure you have the data for Queens County (highlighted below) and not the entire U.S. An official w it Here's now you know United States" Queens New York income x 1 4 Q Advanced Search Census Bureau Tables Maps Profiles Pages $1901 | Income in the Past 12 Months (in 2022 Inflation-Adjuste 2 Filters 432 Results Dollars) American Community Survey | 2032: ACS 1-Year Estimates Subject Tables 432 Queens County, New York View: 10 | 25 | 50 Download Table Data Queens County, New York Income [Households, Families, In.. American Community Survey Households Clear search $1901 | Income in the Past 12 Months (in 2022 Infla.. View All 25 Products Label Estimate Total 839,85 Search for a filter American Community Survey Less than $10,000 5.9% Geography $1902 | Mean Income in the Past 12 Months (in 202.. $10,000 to $14,999 3.7% View All 25 Products Nation $15,000 to $24,999 6.3% State American Community Survey $25,000 to $34,999 6.8% $1903 | Median Income in the Past 12 Months (in 2... $35,000 to $49,999 8.5% View All 25 Products 16.0% County Subdivision $50,000 to $74,999 Place American Community Survey $75,000 to $99,999 12.0% $2001 | Earnings in the Past 12 Months (in 2022 Infl.. $100,000 to $149,999 18.3% ZIP Code Tabulation Area > View All 25 Products $150,000 to $198,999 10.5% Metropolitan/Micropolitan Statistical Area > $200,000 or more 11.9% American Community Survey Census Tract> 80.557 $2503 | Financial Characteristics Median income (dollars) Block > View All 25 Products Mean income (dollars) 106,667 Block Group > PERCENT ALLOCATED American Community Survey All Geographies > Household income in the past 1... 52.7% $2506 | Financial Characteristics for Housing Units . Ff Topics View All 25 Products Family income in the past 12 mo...Make sure you use American Community Survey $1901 data (2022: ACS 1-Year Estimates) Subject Tables - do not use ACS 5-year averages or others) and use household incomes. Also, for some counties, the names may be case sensitive (New York vs. new york). Be extra careful and always check that you have the data for the correct county (if you mistype, it will automatically use National data). There will be no credit it you use wrong data! Calculate the income GINI coefficients for households in Queens County. Do the same for the other remaining 13 counties. You need to calculate a total of 14 GINI coefficients. Show your work on 14 different Excel worksheets, one for each county. Also calculate the respective mean/median income ratios. List your results for all counties on a separate summary worksheet. Please use the solution template that is posted under \"Content\" on Brightspace. Part 2 Now produce 4 scatterplots in Excel, on the Summary worksheet. For all scatterplots plot the GINI coefficients from Part 1 on the horizontal x-axis. a) GINI and Index Crime Rate b) GINI and Violent Crime Rate c) GINI and Property Crime Rate d) GINI and Violent Crime Rates w/ Firearms NY State prowdes crime statlstlcs at Select crime rates (which are per 100,000 population) for 2021. For each scatterplot, add a linear trendline that also shows the equation (you can also add the R2 but that is not required). Do not set the intercept. Below is an example (using made-up data): Violent Crime Rate w/ Firearms and Gini Coefficients 70 & y = 158.99x - 30.1 % " R? = 0.8761 o .o 50 o 40 30 e 20 os 10 Violent Crime Rate w/ Firearms 0.000 0.100 0.200 0.300 0.400 0.500 0.600 0.700 GINI
Step by Step Solution
There are 3 Steps involved in it

Get step-by-step solutions from verified subject matter experts