

Question: This is a Statistics 151 question that I'm having trouble understanding. Please answer all parts and be detailed and thorough with your answer. As well
This is a Statistics 151 question that I'm having trouble understanding. Please answer all parts and be detailed and thorough with your answer. As well as make it easy to read. Will upvote as soon as the answer is given! Rcommandr is needed for the second part.
How do I upload an excel spreadsheet ?
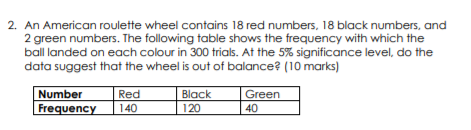
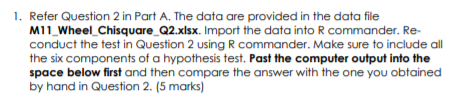
2. An American roulette wheel contains 18 red numbers, 18 black numbers, and 2 green numbers. The following table shows the frequency with which the ball landed on each colour in 300 trials. At the 5% significance level, do the data suggest that the wheel is out of balance? (10 marks) Number Frequency Red 140 Black 120 Green 40 1. Refer Question 2 in Part A. The data are provided in the data file M11_Wheel_Chisquare_Q2.xlsx. Import the data into R commander. Re- conduct the test in Question 2 using R commander. Make sure to include all the six components of a hypothesis test. Past the computer output into the space below first and then compare the answer with the one you obtained by hand in Question 2Step by Step Solution
There are 3 Steps involved in it
1 Expert Approved Answer
Step: 1 Unlock

Question Has Been Solved by an Expert!
Get step-by-step solutions from verified subject matter experts
Step: 2 Unlock
Step: 3 Unlock