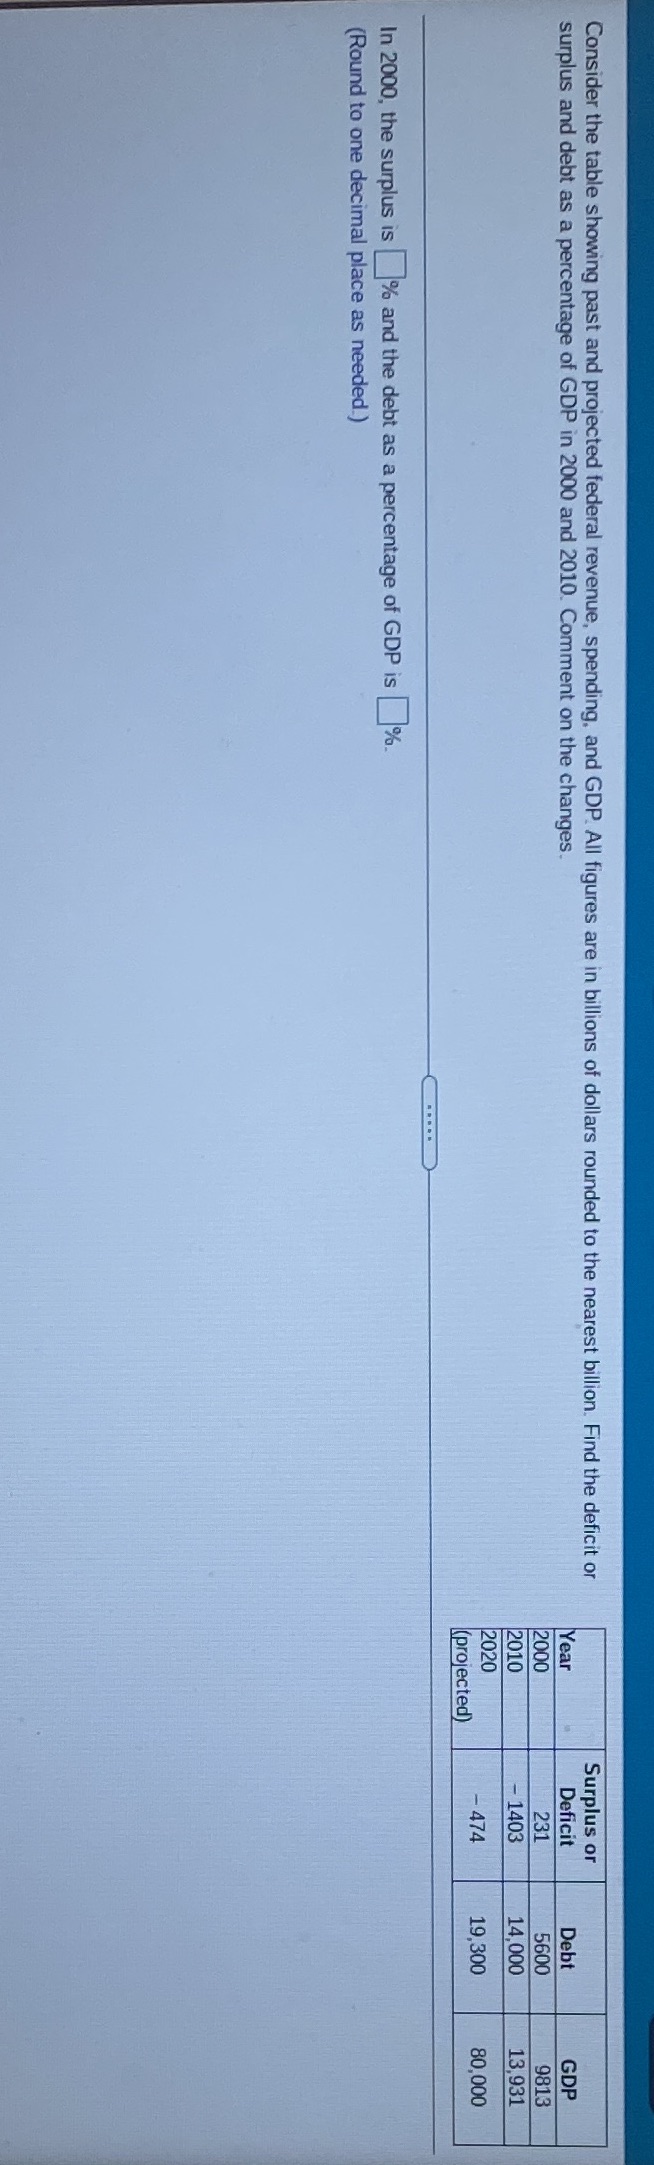
Question: This is a three part question. So I'll have so follow up questions after the first one. Consider the table showing past and projected federal

This is a three part question. So I'll have so follow up questions after the first one.

This is a three part question. So I'll have so
Consider the table showing past and projected federal revenue, spending, and GDP. All figures are in billions of dollars rounded to the nearest billion. Find the deficit or Surplus or surplus and debt as a percentage of GDP in 2000 and 2010. Comment on the changes. Year Deficit Debt GDP 2000 231 5600 9813 2010 - 1403 14,000 13,931 2020 -474 19,300 80,000 (projected) In 2000, the surplus is % and the debt as a percentage of GDP is% (Round to one decimal place as needed.)

Step by Step Solution

There are 3 Steps involved in it

1 Expert Approved Answer
Step: 1 Unlock blur-text-image
Question Has Been Solved by an Expert!

Get step-by-step solutions from verified subject matter experts

Step: 2 Unlock
Step: 3 Unlock

Students Have Also Explored These Related Mathematics Questions!