

Question: this is a time series question please answer ALL PARTS (a-c) in R CODE. 2.3 In this problem, we explore the difference between a random
this is a time series question please answer ALL PARTS (a-c) in R CODE.
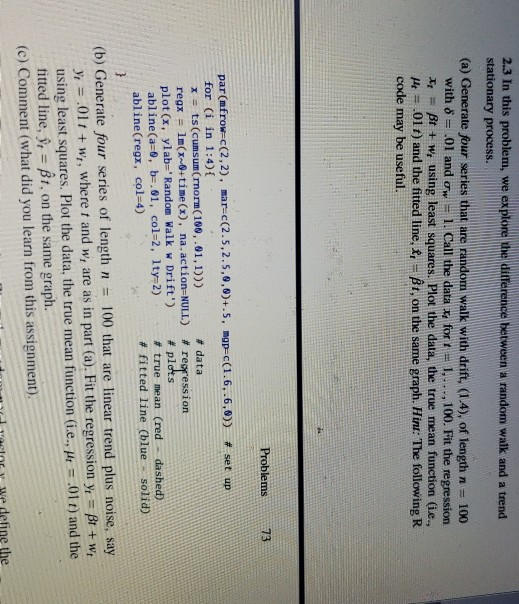
2.3 In this problem, we explore the difference between a random walk and a trend stationary process. (a) Generate four series that are randomm walk with drift, (14), of length n 100 with -.01 and w-1. Call the data x, for t = 1, .. ., 100. Fit the regression Bt+wr using least squares. Plot the data, the true mean function (ie., = .01 t) and the fitted line,ft-t, on the same graph. Hint: The following R code may be useful. Problems73 par(frowc (2,2), marc(2.5,2.5,9,9)+.5, map-c (1.6, .6,9)) # set up for (i in 1:4) x = ts (cumsum(rnorm(100 ,-01,1))) regx_1n(x~0+ time (x), na. action-NULL) plot (x, ylab="Random Walk w Drift') abline(a-, b.01, col-2, 1ty-2) abline(regx, col 4) # data # regression # plc # true mean (red - dashed) # fitted line (blue- solid) (b) Generate four series of length n 100 that are linear trend plus noise, yr = .01 t + wt, where t and w, are as in part (a). Fit the regression yr = t + wt using least squares. Plot the data, the true mean function (i.e., H 01t) and the titted line, , Bt, on the same graph. (c) Comment (what did you learn from this assignment) 1vaster we define the
Step by Step Solution
There are 3 Steps involved in it

Get step-by-step solutions from verified subject matter experts