

Question: This is a two part question. Can someone please help! This Question: 1 pt 5 of 10 (0 complete) This Quiz: 10 pts possible The
This is a two part question. Can someone please help!
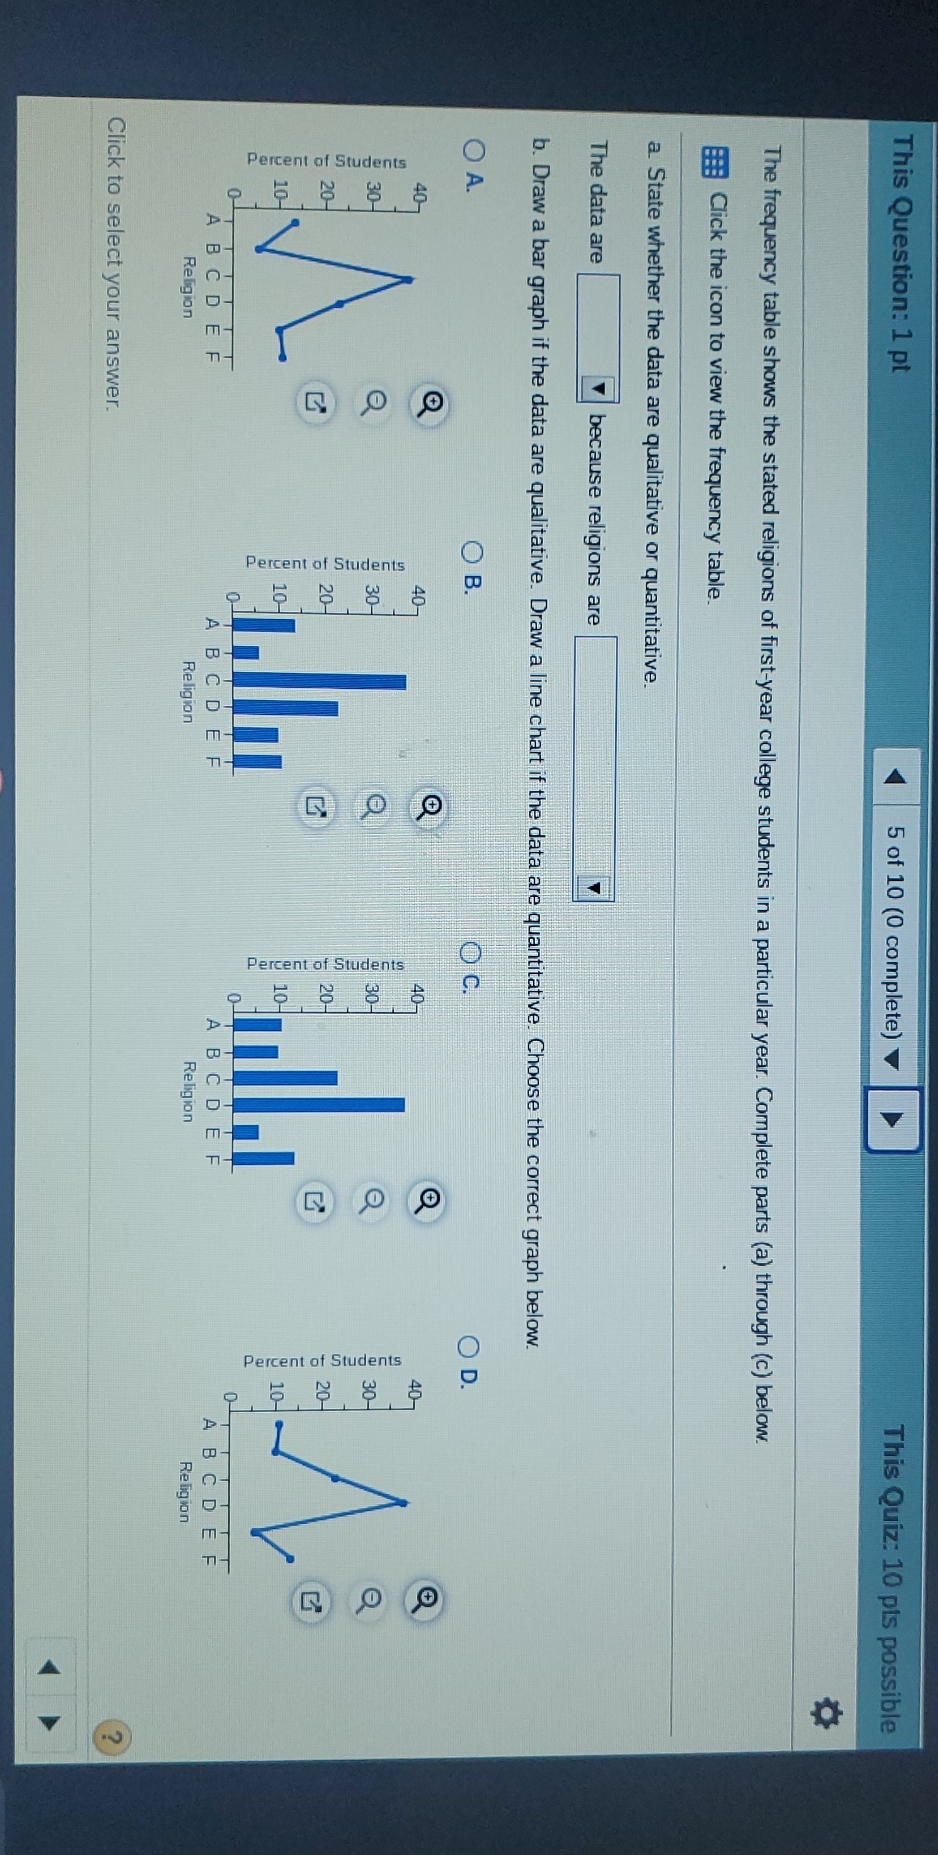
This Question: 1 pt 5 of 10 (0 complete) This Quiz: 10 pts possible The frequency table shows the stated religions of first-year college students in a particular year. Complete parts (a) through (c) below. Click the icon to view the frequency table. a. State whether the data are qualitative or quantitative. The data are because religions are b. Draw a bar graph if the data are qualitative. Draw a line chart if the data are quantitative. Choose the correct graph below. O A. O B. OC. OD. Percent of Students Percent of Students Percent of Students Percent of Students ABCDEF ABCDEF ABCDEF ABCDEF Religion Religion Religion Religion Click to select your
Step by Step Solution
There are 3 Steps involved in it

Get step-by-step solutions from verified subject matter experts