

Question: This is a two part question, I need to know where to draw the lines and there is also a multiple choice question The graph
This is a two part question, I need to know where to draw the lines and there is also a multiple choice question
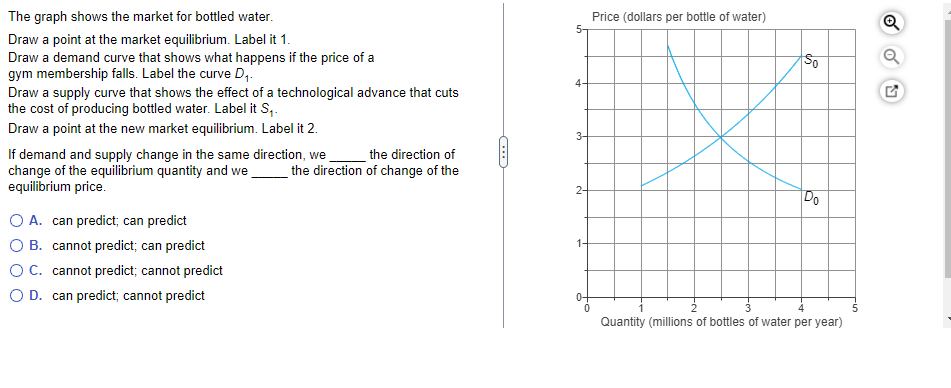
The graph shows the market for bottled water. Draw a point at the market equilibrium. Label it 1. Draw a demand curve that shows what happens it the plice of a gym membership falls. Label the curve 01. Draw a supply curve that shows the effect of a technological advance that cuts the cost ofproducing bottled water. Label it 8,. Draw a point at the new market equilibrium. Label it 2. If demand and supply change in the same direction; we the direction of change of the equilibrium quantity and we the direction of change of the equilibrium price. O A. can predict; can predict O B. cannot predict; can predict O (I. cannot predict; cannot predict O D. can predict; cannot predict Price [dollars per bottle of water} Quantity (millions of bottles of water per year}
Step by Step Solution
There are 3 Steps involved in it

Get step-by-step solutions from verified subject matter experts