

Question: This is about synergy value allocation to the specific items in post-merger phase. Background: Acquiring firm has identified the $10m of cost synergy (they did
This is about synergy value allocation to the specific items in post-merger phase.
Background:
- Acquiring firm has identified the $10m of cost synergy (they did not quantify nor measure the revenue synergy) (In the Scheme Booklet).
- We have identified the specific items that could get impacted by such realisable synergies as well as total synergy value of $15m, which is different from the Scheme Booklet ($5m gap)
The break down of specific items of cost synergy are listed following:
- Redundancy Savings - Elimination of duplicate costs including facilities, premises and administrative services
- Efficiency savings - Elimination of duplicate assets, network supply and backhaul costs
- Corporate cost rationalization - Scale efficiencies through a leaner cost structure and more flexible commercial model to improve market competitiveness
- Economies of scope - Combined group's technology capability
The break down of specific items of revenue synergy are listed following:
- Increased market share - Increased market share in the Greenfield FTTP construction market
- Cross-selling - Expand into adjacent FTTP build markets including retirement living, lifestyle communities, commercial and industrial precincts
- Leveraging marketing resources and capabilities - Ability to challenge dominant fibre players in Brownfields opportunities and consumer markets for Australia
At this point, I do NOT know how much synergy value are allocated to each item, and want to know how to determine the proportion of allocated synergy as well as the calculation of synergy for each item.
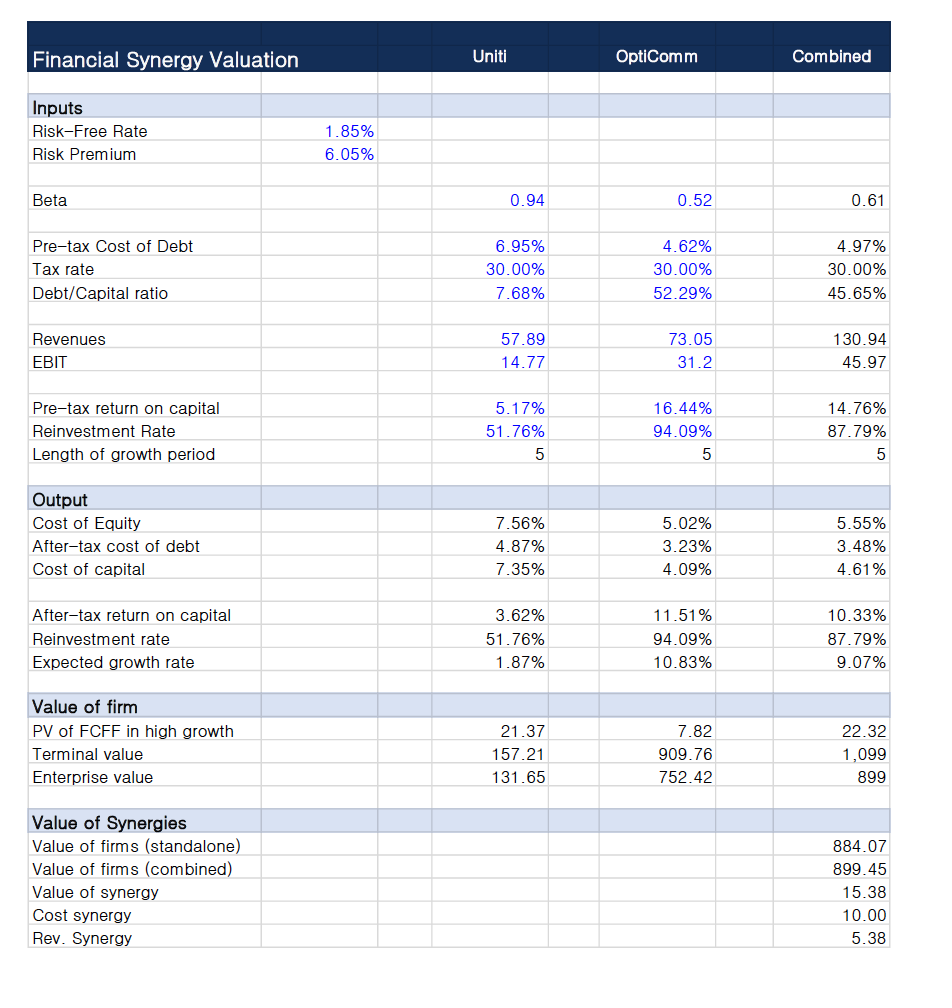
(Synergy Calculation)

Financial Synergy Valuation Uniti OptiComm Combined Inputs Risk-Free Rate 1.85% Risk Premium 6.05% Beta 0.94 0.52 0.61 Pre-tax Cost of Debt 6.95% 4.62% 4.97% Tax rate 30.00% 30.00% 30.00% Debt/Capital ratio 7.68% 52.29% 45.65% Revenues 57.89 73.05 130.94 EBIT 14.77 31.2 45.97 Pre-tax return on capital 5.17% 16.44% 14.76% Reinvestment Rate 51.76% 94.09% 87.79% Length of growth period 5 5 5 Output Cost of Equity 7.56% 5.02% 5.55% After-tax cost of debt 4.87% 3.23% 3.48% Cost of capital 7.35% 4.09% 4.61% After-tax return on capital 3.62% 11.51% 10.33% Reinvestment rate 51.76% 94.09% 87.79% Expected growth rate 1.87% 10.83% 9.07% Value of firm PV of FCFF in high growth 21.37 7.82 22.32 Terminal value 157.21 909.76 1,099 Enterprise value 131.65 752.42 399 Value of Synergies Value of firms (standalone) 884.07 Value of firms (combined) 899. 45 Value of synergy 15.38 Cost synergy 10.00 Rev. Synergy 5.38
Step by Step Solution
There are 3 Steps involved in it

Get step-by-step solutions from verified subject matter experts