

Question: This is achived using freeglut on visual studio. 1. Plot the contour of the function z = (x2 + y2 - 1)3 - x2 *
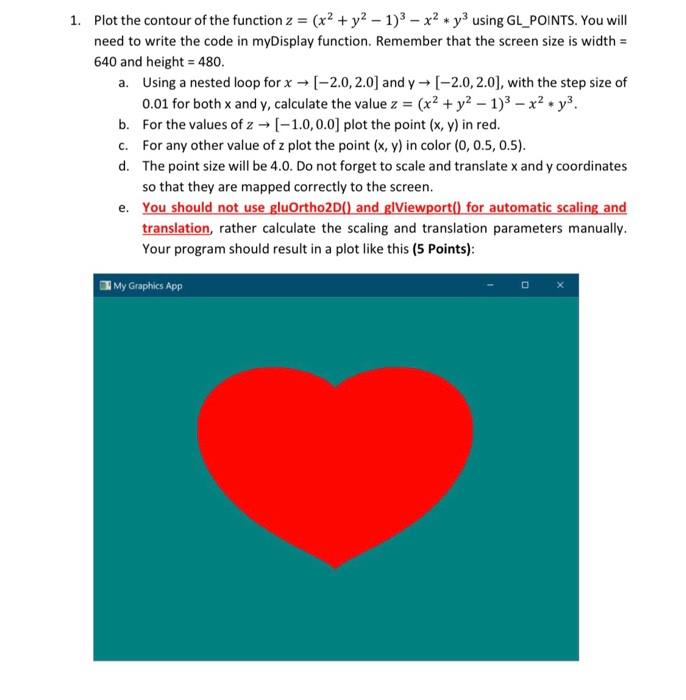
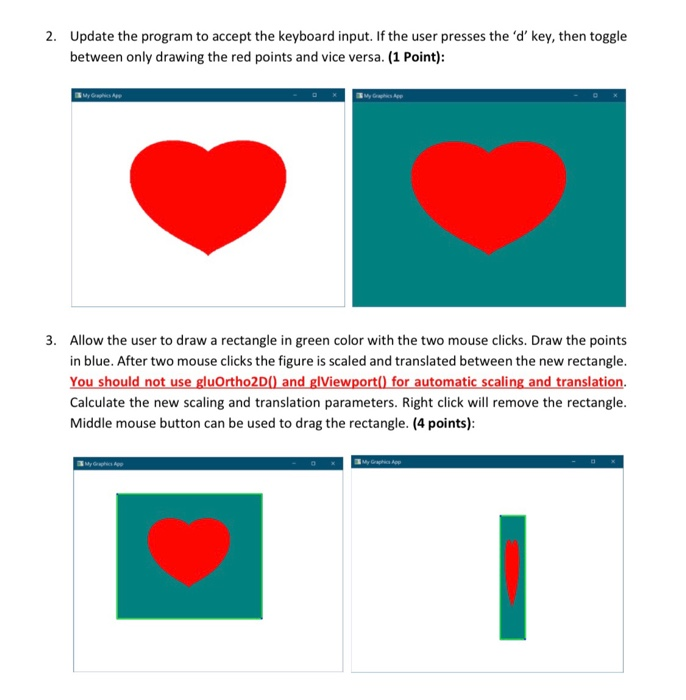
1. Plot the contour of the function z = (x2 + y2 - 1)3 - x2 * y3 using GL_POINTS. You will need to write the code in myDisplay function. Remember that the screen size is width = 640 and height = 480. a. Using a nested loop for x [-2.0, 2.0) and y [-2.0, 2.0), with the step size of 0.01 for both x and y, calculate the value z = (x2 + y2 - 1)3 - x2 - y3. b. For the values of 2 + (-1.0, 0.0] plot the point (x, y) in red. C. For any other value of z plot the point (x, y) in color (0, 0.5, 0.5). d. The point size will be 4.0. Do not forget to scale and translate x and y coordinates so that they are mapped correctly to the screen. e. You should not use gluOrtho2D() and glViewport() for automatic scaling and translation, rather calculate the scaling and translation parameters manually. Your program should result in a plot like this (5 Points): My Graphics App 2. Update the program to accept the keyboard input. If the user presses the 'd' key, then toggle between only drawing the red points and vice versa. (1 Point): 3. Allow the user to draw a rectangle in green color with the two mouse clicks. Draw the points in blue. After two mouse clicks the figure is scaled and translated between the new rectangle. You should not use gluOrtho2D() and glViewport() for automatic scaling and translation. Calculate the new scaling and translation parameters. Right click will remove the rectangle. Middle mouse button can be used to drag the rectangle. (4 points): 1. Plot the contour of the function z = (x2 + y2 - 1)3 - x2 * y3 using GL_POINTS. You will need to write the code in myDisplay function. Remember that the screen size is width = 640 and height = 480. a. Using a nested loop for x [-2.0, 2.0) and y [-2.0, 2.0), with the step size of 0.01 for both x and y, calculate the value z = (x2 + y2 - 1)3 - x2 - y3. b. For the values of 2 + (-1.0, 0.0] plot the point (x, y) in red. C. For any other value of z plot the point (x, y) in color (0, 0.5, 0.5). d. The point size will be 4.0. Do not forget to scale and translate x and y coordinates so that they are mapped correctly to the screen. e. You should not use gluOrtho2D() and glViewport() for automatic scaling and translation, rather calculate the scaling and translation parameters manually. Your program should result in a plot like this (5 Points): My Graphics App 2. Update the program to accept the keyboard input. If the user presses the 'd' key, then toggle between only drawing the red points and vice versa. (1 Point): 3. Allow the user to draw a rectangle in green color with the two mouse clicks. Draw the points in blue. After two mouse clicks the figure is scaled and translated between the new rectangle. You should not use gluOrtho2D() and glViewport() for automatic scaling and translation. Calculate the new scaling and translation parameters. Right click will remove the rectangle. Middle mouse button can be used to drag the rectangle. (4 points)
Step by Step Solution
There are 3 Steps involved in it

Get step-by-step solutions from verified subject matter experts