

Question: This is all I have for now, I need this in this kind of format # File: create_data_analysis_reports.py # A program to print repors of
This is all I have for now, I need this in this kind of format
# File: create_data_analysis_reports.py # A program to print repors of population data from a file
from my_population_groups import PopulationGroup
def main(): populations = get_data() population.sort(key=by_data_name) print_reports(data, 'By age group')
I ALSO IMPORT ANOTHER USING PopulationGroup class.
Create a Python program named create_data_analysis_reports. When complete, you will run this program to produce a series of four data analysis reports that will help you understand the data set. These reports include:
- Counts by Age Group
- Counts by Descending Total Count
- Counts by Descending Male Count
- Counts by Descending Female Count
These four reports are expected to print in the order shown. When this program is run, the following console session output should be generated:
Please enter the input filename: cleaned_data.txt
Counts by Age Group
Age Group Males Females Total Percent 0-14 97,680 93,991 191,671 20.13 15-19 32,840 32,479 65,319 6.96 20-24 38,953 41,206 80,159 8.42 25-29 36,775 38,205 74,980 7.88 30-34 37,072 39,197 76,269 8.01 35-39 30,337 31,464 61,801 6.49 40-44 28,176 29,271 57,447 6.03 45-54 57,519 60,283 117,802 12.37 55-64 52,893 57,669 110,562 11.61 65-74 28,577 34,212 62,789 6.60 75-84 13,743 20,822 34,565 3.63 85+ 5,775 12,843 18,618 1.96 Total 460,340 491,642 951,982 100.00
Counts by Descending Total Count
Age Group Males Females Total Percent 0-14 97,680 93,991 191,671 20.13 45-54 57,519 60,283 117,802 12.37 55-64 52,893 57,669 110,562 11.61 20-24 38,953 41,206 80,159 8.42 30-34 37,072 39,197 76,269 8.01 25-29 36,775 38,205 74,980 7.88 15-19 32,840 32,479 65,319 6.86 65-74 28,577 34,212 62,789 6.60 35-39 30,337 31,464 61,801 6.49 40-44 28,176 29,271 57,447 6.03 75-84 13,743 20,822 34,565 3.63 85+ 5,775 12,843 18,618 1.96 Total 460,340 491,642 951,982 100.00
Counts by Descending Male Count
Age Group Males Females Total Percent 0-14 97,680 93,991 191,671 20.13 45-54 57,519 60,283 117,802 12.37 55-64 52,893 57,669 110,562 11.61 20-24 38,953 41,206 80,159 8.42 30-34 37,072 39,197 76,269 8.01 25-29 36,775 38,205 74,980 7.88 15-19 32,840 32,479 65,319 6.86 35-39 30,337 31,464 61,801 6.49 65-74 28,577 34,212 62,789 6.60 40-44 28,176 29,271 57,447 6.03 75-84 13,743 20,822 34,565 3.63 85+ 5,775 12,843 18,618 1.96 Total 460,340 491,642 951,982 100.00
Counts by Descending Female Count
Age Group Males Females Total Percent 0-14 97,680 93,991 191,671 20.13 45-54 57,519 60,283 117,802 12.37 55-64 52,893 57,669 110,562 11.61 20-24 38,953 41,206 80,159 8.42 30-34 37,072 39,197 76,269 8.01 25-29 36,775 38,205 74,980 7.88 65-74 28,577 34,212 62,789 6.60 15-19 32,840 32,479 65,319 6.86 35-39 30,337 31,464 61,801 6.49 40-44 28,176 29,271 57,447 6.03 75-84 13,743 20,822 34,565 3.63 85+ 5,775 12,843 18,618 1.96 Total 460,340 491,642 951,982 100.00
The following is pseudocode that you may use to help design your main function:
do build_population_group_list do calculate_column_totals
sort population groups by age group do print_report
sort population groups by total_count descending do print_report
sort population groups by male_count descending do print_report
sort population groups by female_count descending do print_report
The following is pseudocode that you may use to help design your build_population_group_list function:
prompt for infile open infile with encoding utf8 initalize population_groups_list
for line in infile: split line into strings convert male_count and female_count to ints construct a new PopulationGroup instance if this line is NOT the total line: construct a new PopulationGroup instance append instance to population_groups list close infile return population_groups_list
The following is pseudocode that you may use to help design your calculate_column_totals function:
Receive population_groups_list as parameter initialize male_total, female_total, overall_total, percent_total
for group in population_groups_list: accumulate male_total, female_total, overall_total, percent_total
return male_total, female_total, overall_total, percent_total
The following is pseudocode that you may use to help design your print_report function:
receive population_groups_list, title as parameters print blank lines print title print column headings
for group in population_groups_list: print a report line using values from PopulationGroup instance
print column total line using male_total, female_total, overall_total, percent_total
When formatting the report lines, remember the following hints:
- Report lines are 50 characters wide.
- Each column is 10 characters wide.
- The report title is centered within the 50-character line.
- A format string that will be useful on the report title is: {0:^50}
- A format string that will be useful on the count-based detail is: {1:>10,}
- A format string that will be useful for the percent-based detail is: {1:>10.2f}
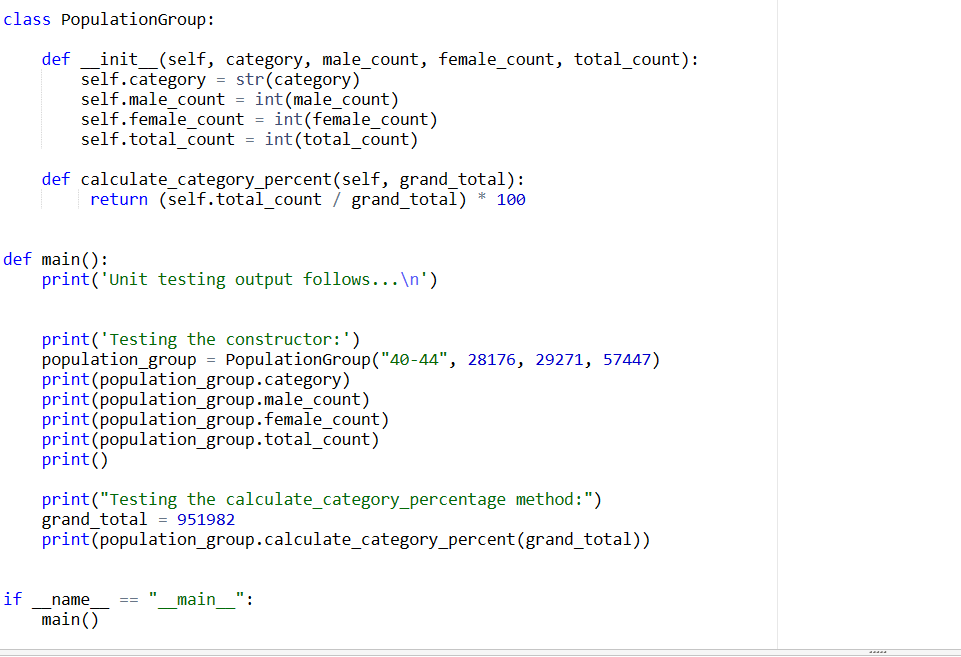
class Populationgroup: def_init_(self, category, male_count, female_count, total_count): self.category =str( category) self.male_count = int (male_count) self.female_count = int ( female_count ) self.total_count = int (total_count) def calculate_category_percent(self, grand_total): return (self.total_count / grand_tota l)100 def main(): print('Unit testing output follows... ') print('Testing the constructor:') population_group = PopulationGroup ("40-44", 28176, 29271, 57447) print(population_group.category) print(population_group.male_count) print(population_group.female_count) print(population_group.total_count) print() print("Testing the calculate_category_percentage method:") grand_total =951982 print(population_group.calculate_category_percent(grand_total)) if main()name==" main__
Step by Step Solution
There are 3 Steps involved in it

Get step-by-step solutions from verified subject matter experts