

Question: this is all one question... It is impossible to get a complete picture of a company's condition and performance simply by analyzing its Income Statement.
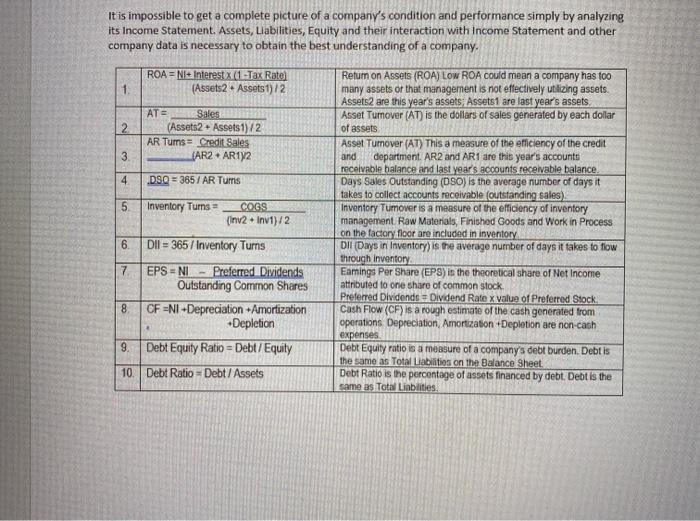
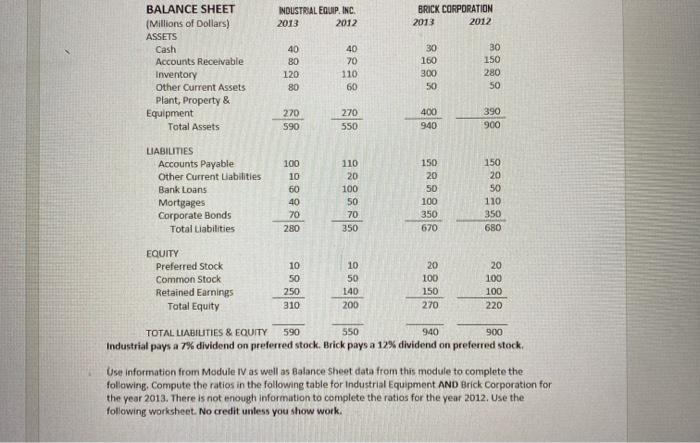
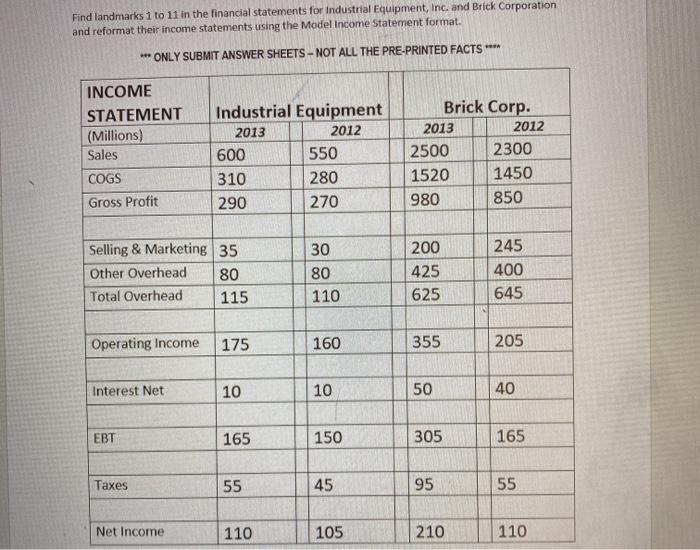
It is impossible to get a complete picture of a company's condition and performance simply by analyzing its Income Statement. Assets, Liabilities, Equity and their interaction with Income Statement and other company data is necessary to obtain the best understanding of a company. 1 ROA = NI4. Interest 1 Tax Rate) (Assets2. Assets 1)/2 2 ATE Sales (Assets2 - Assets 1)/2 AR Tums Credit Sales AR2. AR12 3. 4 DSQ = 365/ AR Turns 5 Inventory Turns COGS (Inv2 + Inv1)/2 Refum on Assets (ROA) LOW ROA could mean a company has too many assets of that management is not effectively utilizing assets. Assets are this year's assets; Assets are last year's assets Asset Tumover (AT) is the dollars of sales generated by each dollar of assets Asset Tumover (AT) This a measure of the efficiency of the credit and department. AR2 and AR1 are this year's accounts receivable balance and last year's accounts receivable balance Days Sales Outstanding (DSO) is the average number of days it takes to collect accounts receivable (outstanding sales) Inventory Tumover is a measure of the efficiency of inventory management Raw Materials, Finished Goods and Work in Process on the factory floor are included in inventory DI (Days in Inventory) is the average number of days it takes to fiow through inventor Earnings Per Share (EPS) is the theoretical share of Net Income attributed to one share of common stock Preferred Dividends - Dividend Rate x value of Preferred Stock Cash Flow (CF) is a rough estimate of the cash generated from operations Depreciation Amortization Depletion are non-cash expenses Debt Equity ratio is a measure of a company's debt burden. Debt is the same as Total Liabilities on the Balance Sheet Debt Ratio is the percentage of assets financed by debt. Debt is the Same as Total Liabilities, Ico 7 Dil = 365/Inventory Turns EPS-NI Preferred Dividends Outstanding Common Shares CF =Ni-Depreciation Amortization Depletion Debt Equity Ratio Debt / Equity 8 9 10. Debt Ratio - Debt / Assets INDUSTRIAL EQUIP, INC. 2013 2012 BRICK CORPORATION 2013 2012 BALANCE SHEET (Millions of dollars) ASSETS Cash Accounts Receivable Inventory Other Current Assets Plant, Property & Equipment Total Assets 40 80 120 80 40 70 110 60 30 160 300 50 30 150 280 50 270 590 270 550 400 940 390 900 LIABILITIES Accounts Payable Other Current Liabilities Bank Loans Mortgages Corporate Bonds Total Liabilities 100 10 60 40 70 280 110 20 100 50 70 350 150 20 50 100 350 150 20 50 110 350 680 670 20 EQUITY Preferred Stock Common Stock Retained Earnings Total Equity 100 10 50 250 310 10 50 140 200 20 100 150 270 100 220 TOTAL LIABILITIES & EQUITY 590 550 940 900 Industrial pays a 7% dividend on preferred stock. Brick pays a 12% dividend on preferred stock, Use information from Module IV as well as Balance Sheet data from this module to complete the following, Compute the ratios in the following table for Industrial Equipment AND Brick Corporation for the year 2013. There is not enough information to complete the ratios for the year 2012. Use the following worksheet. No credit unless you show work. 1. Return on Assets 2. Asset Turnover 3. Accounts Receivable (AR) Turnover 4. Days Sales Outstanding (DSO) 5. Inventory Turnover 6. Days in Inventory (Dll) 7. Earnings per Share (EPS) 8. Cash Flow 9. Debt Equity Ratio 10. Debt Ratio Find landmarks 1 to 11 in the financial statements for Industrial Equipment, Inc. and Brick Corporation and reformat their income statements using the Model Income Statement format. ***ONLY SUBMIT ANSWER SHEETS - NOT ALL THE PRE-PRINTED FACTS INCOME STATEMENT (Millions) Sales Industrial Equipment 2013 2012 600 550 310 280 290 270 Brick Corp. 2013 2012 2500 2300 1520 1450 980 850 COGS Gross Profit Selling & Marketing 35 Other Overhead Total Overhead 115 80 30 80 110 200 425 625 245 400 645 Operating Income 175 160 355 205 Interest Net 10 10 50 40 EBT 165 150 305 165 Taxes 55 45 95 55 Net Income 110 105 210 110
Step by Step Solution
There are 3 Steps involved in it

Get step-by-step solutions from verified subject matter experts