

Question: This is all one question. Its from applied calc 2 on web assign Consider the graph. , IIIIII!II IIIIIIIII iIIIIIIIII I IIIIIII IIIIIIIII IIIIIIIII (a)
This is all one question. Its from applied calc 2 on web assign
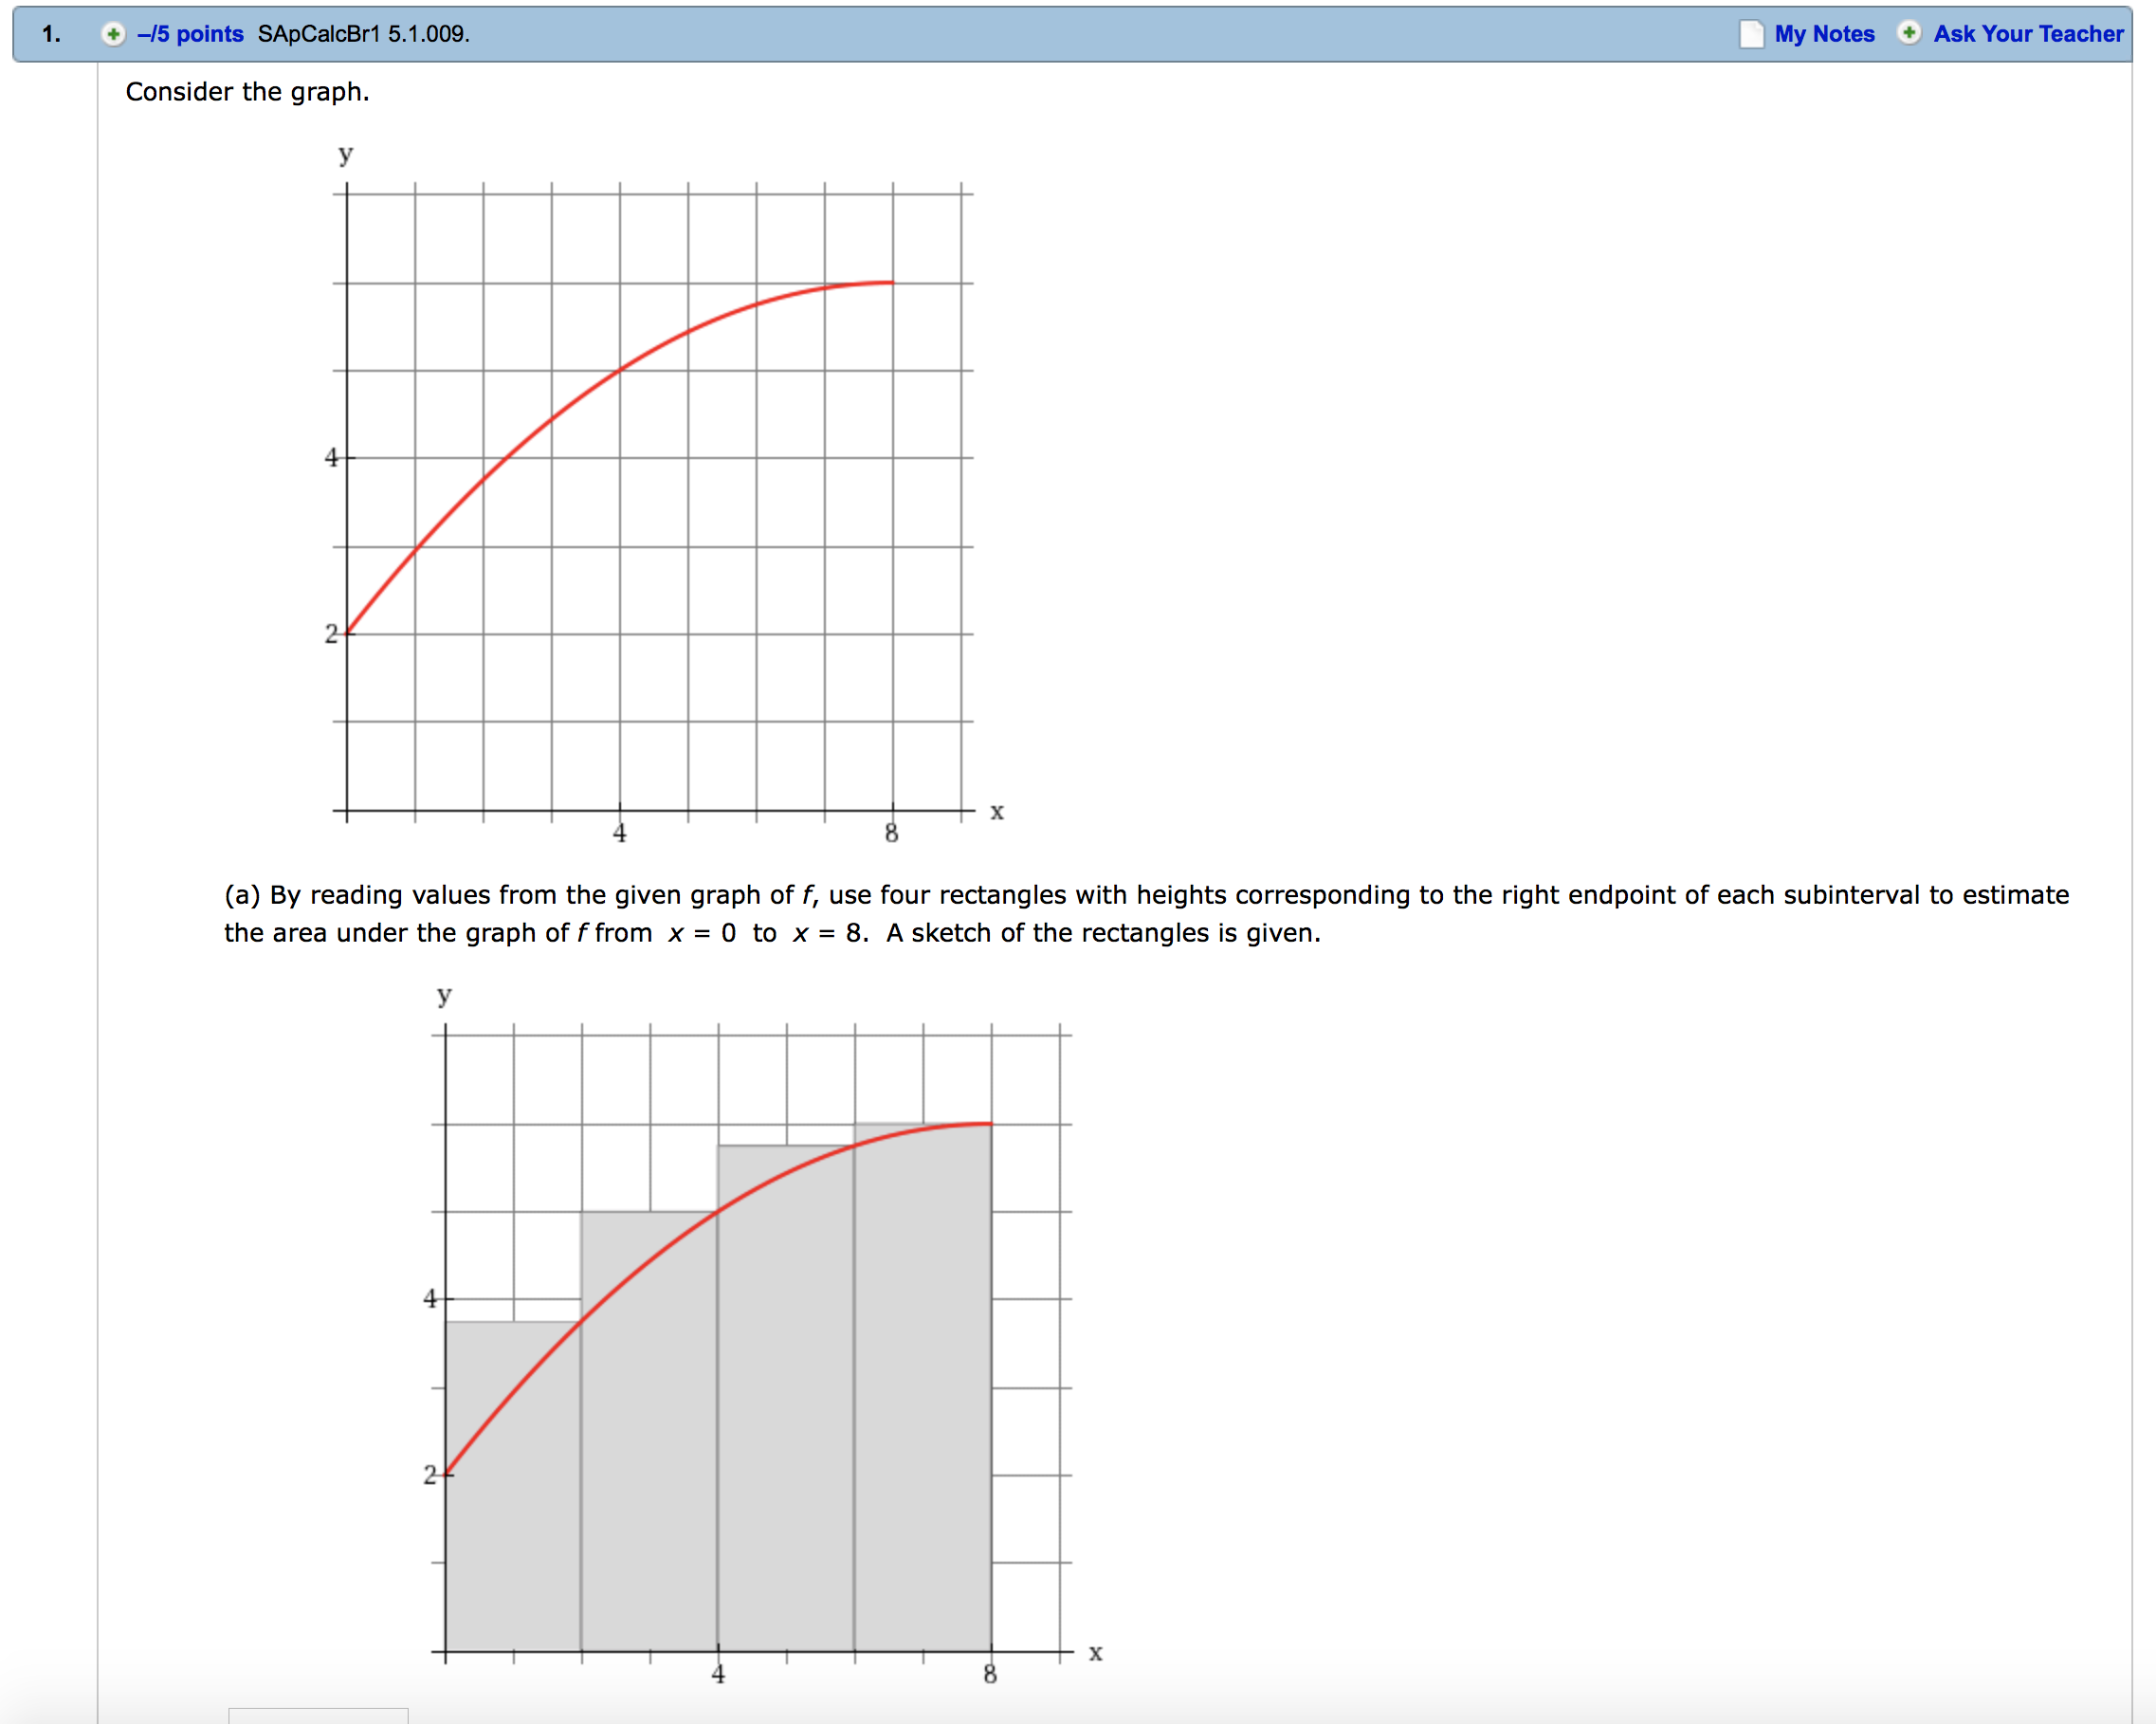
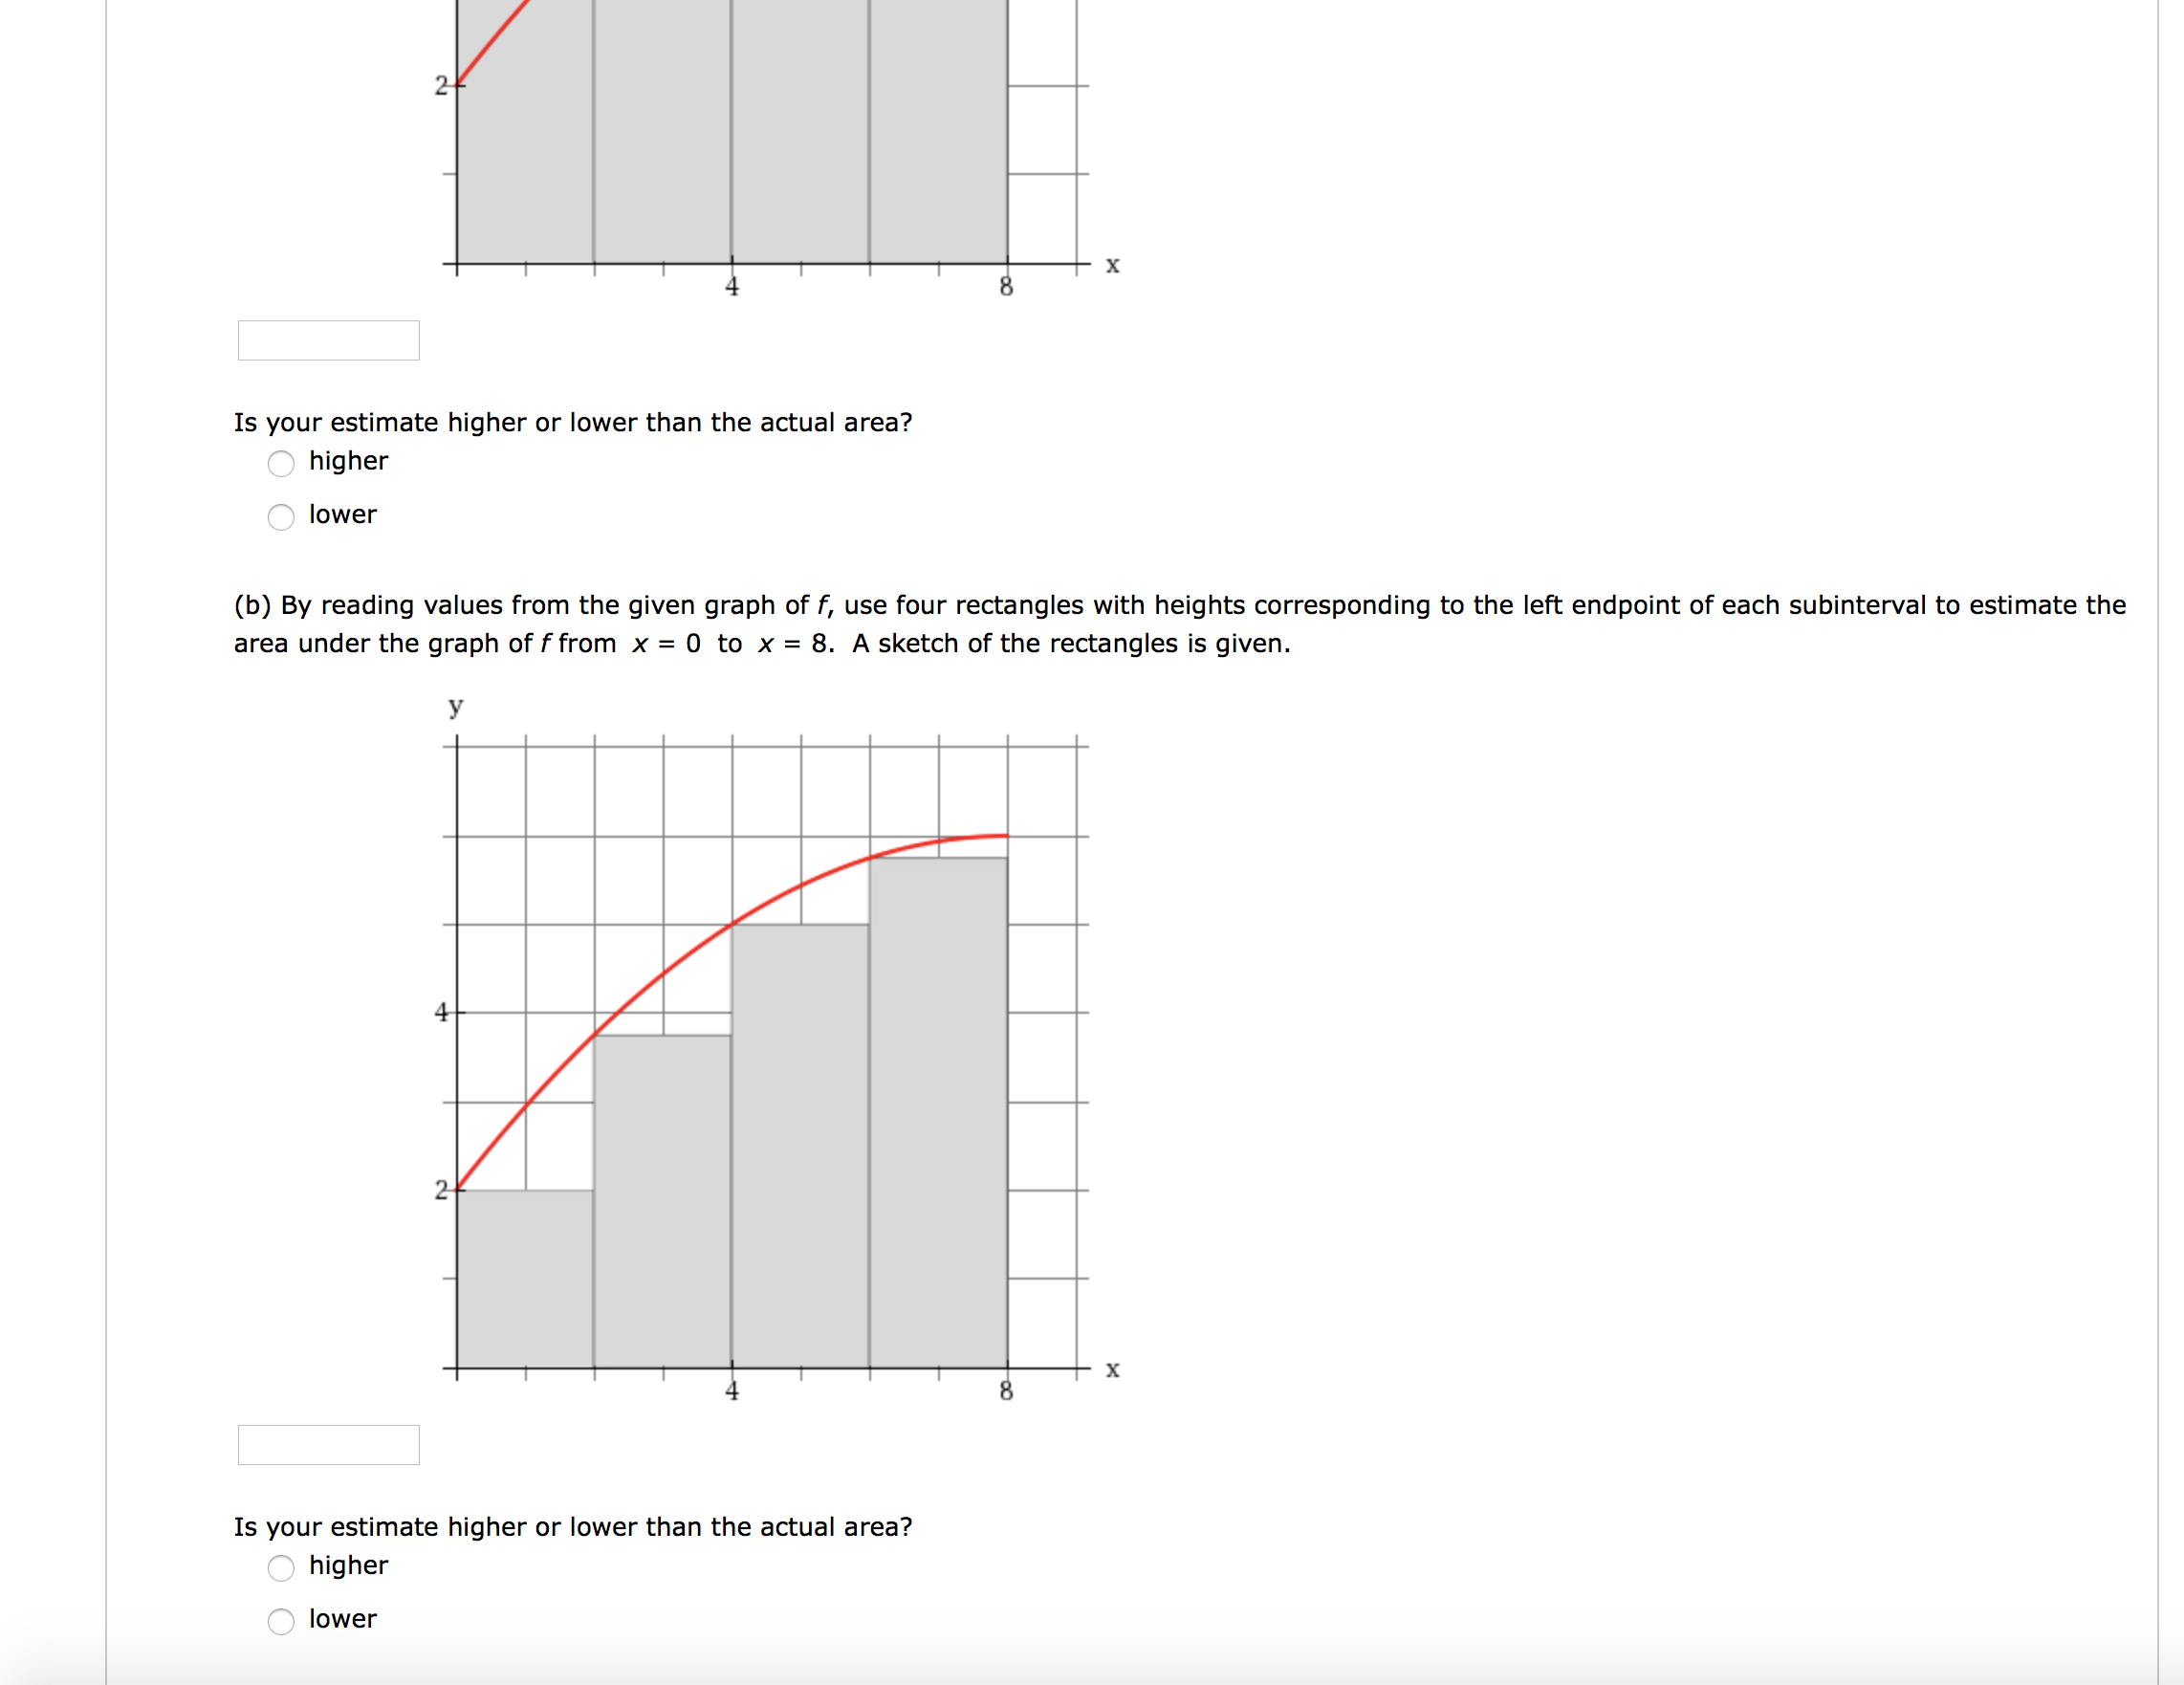
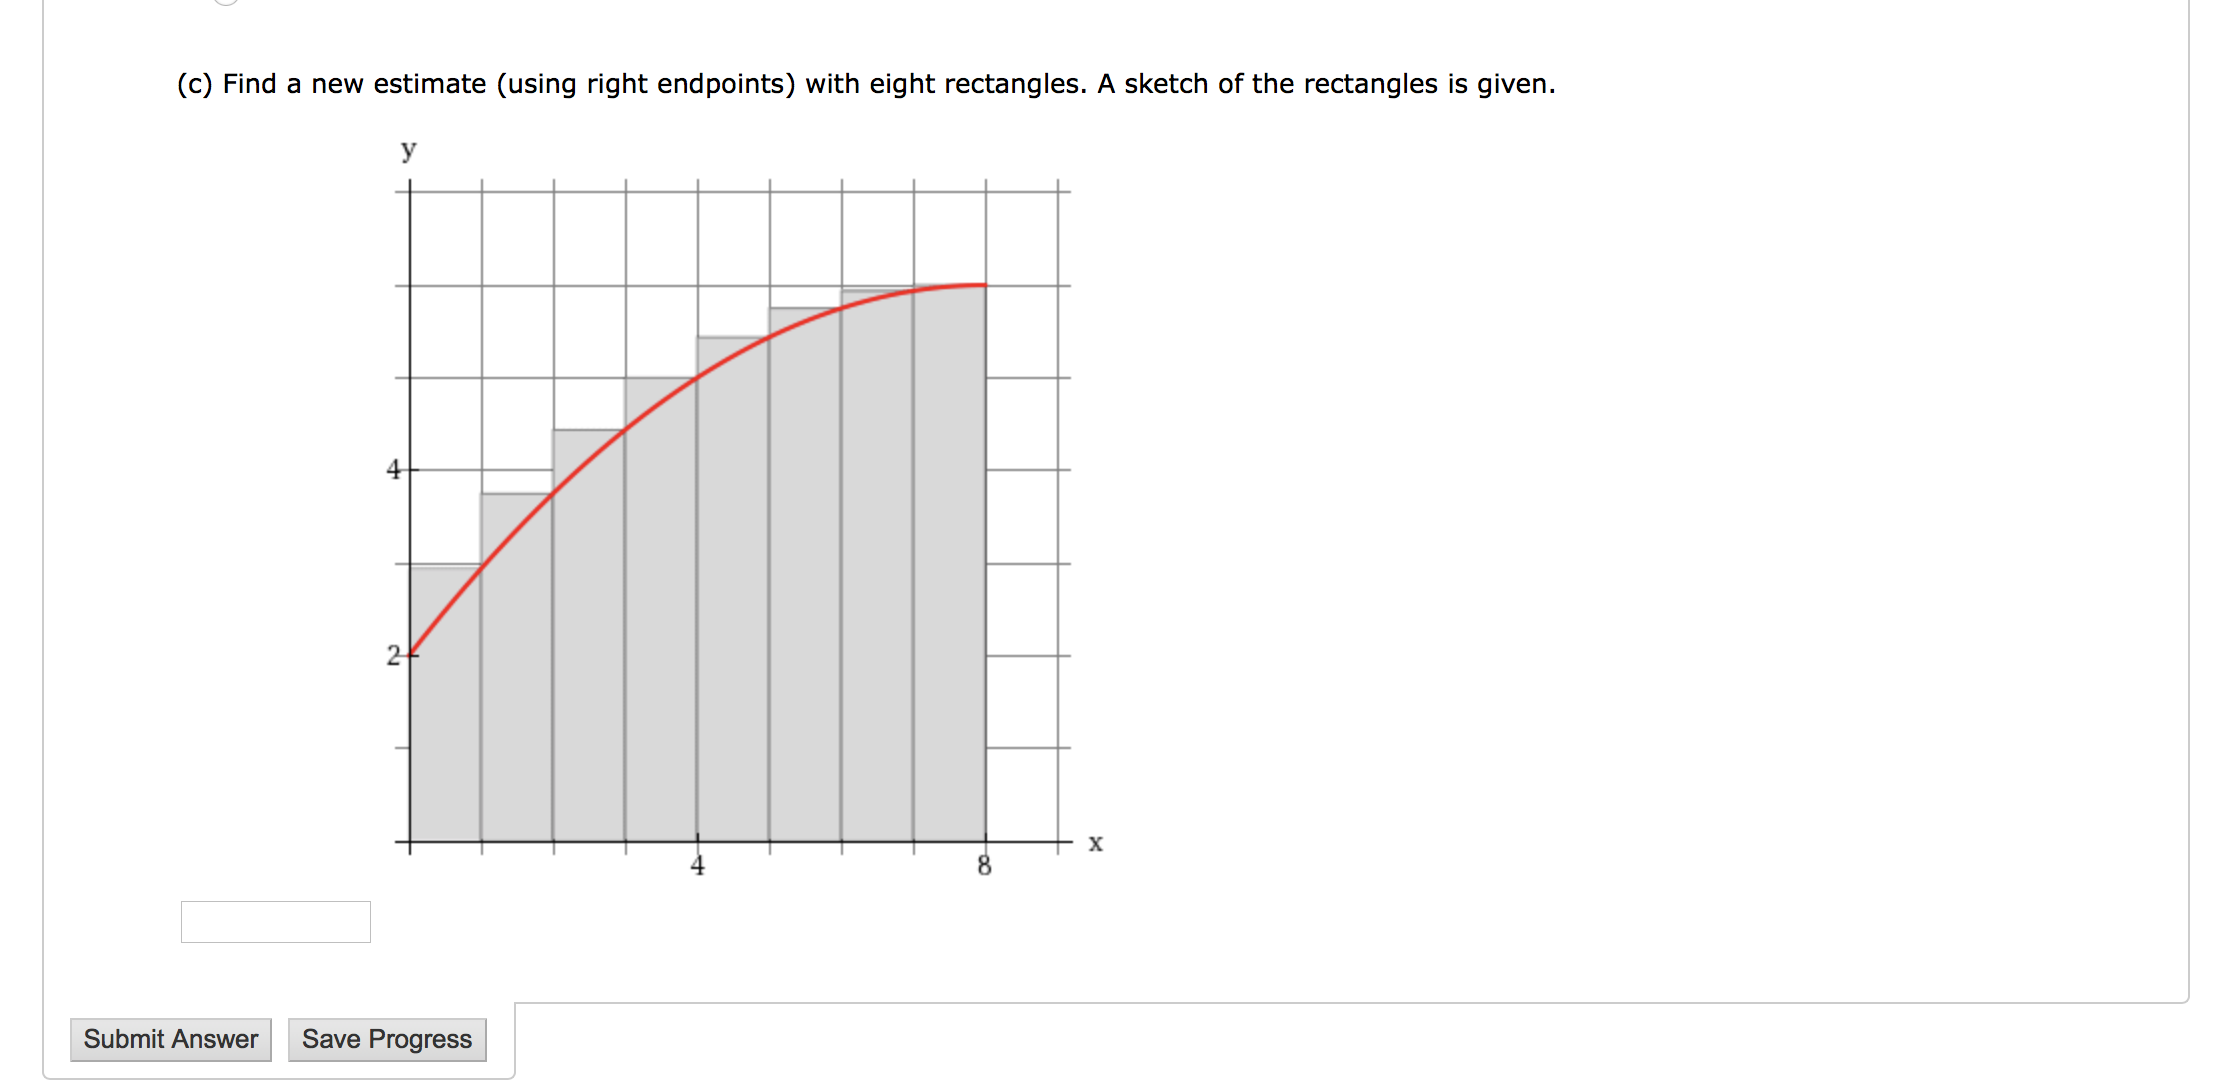
Consider the graph. , IIIIII!II IIIIIIIII iIIIIIIIII I IIIIIII IIIIIIIII IIIIIIIII (a) By reading values from the given graph of f, use four rectangles with heights corresponding to the right endpoint of each subinterval to estimate the area under the graph of ffrom x = 0 to x = 8. A sketch of the rectangles is given. Is your estimate higher or lower than the actual area? 0 higher 0 lower (b) By reading values from the given graph of f, use four rectangles with heights corresponding to the le endpoint of each subinterval to estimate the area under the graph of ffrom x = 0 to X = 8. A sketch of the rectangles is given. Is your estimate higher or lower than the actual area? 0 higher 0 lower (c) Find a new estimate (using right endpoints) with eight rectangles. A sketch of the rectangles is given
Step by Step Solution
There are 3 Steps involved in it

Get step-by-step solutions from verified subject matter experts