

Question: this is all one question Page 1 1 2 3 4. 5 Question 24 (10 points) The following information pertains to Greenwich Company. Balance Sheet
this is all one question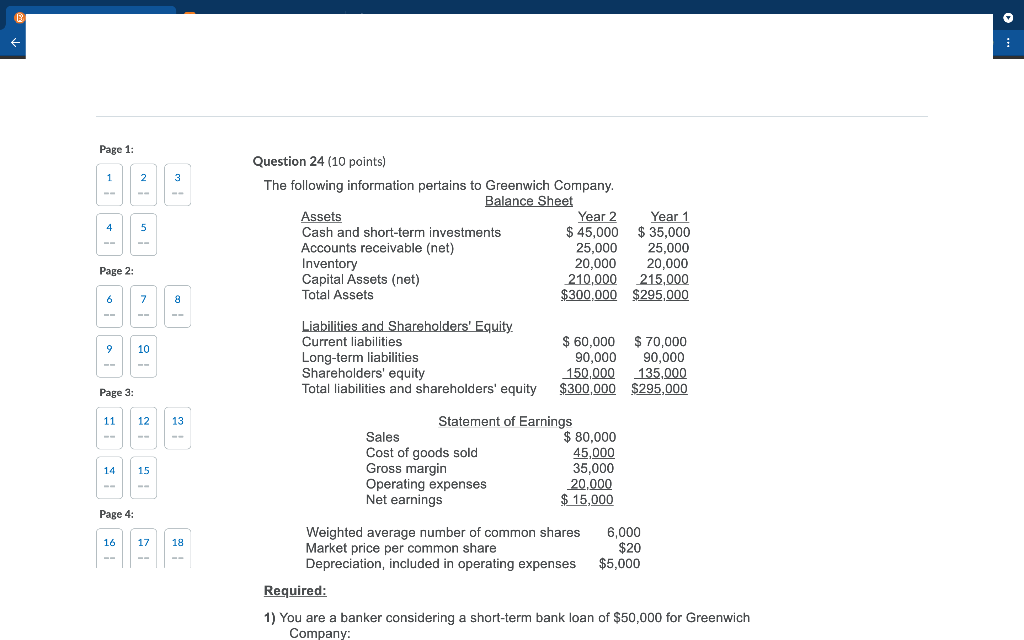
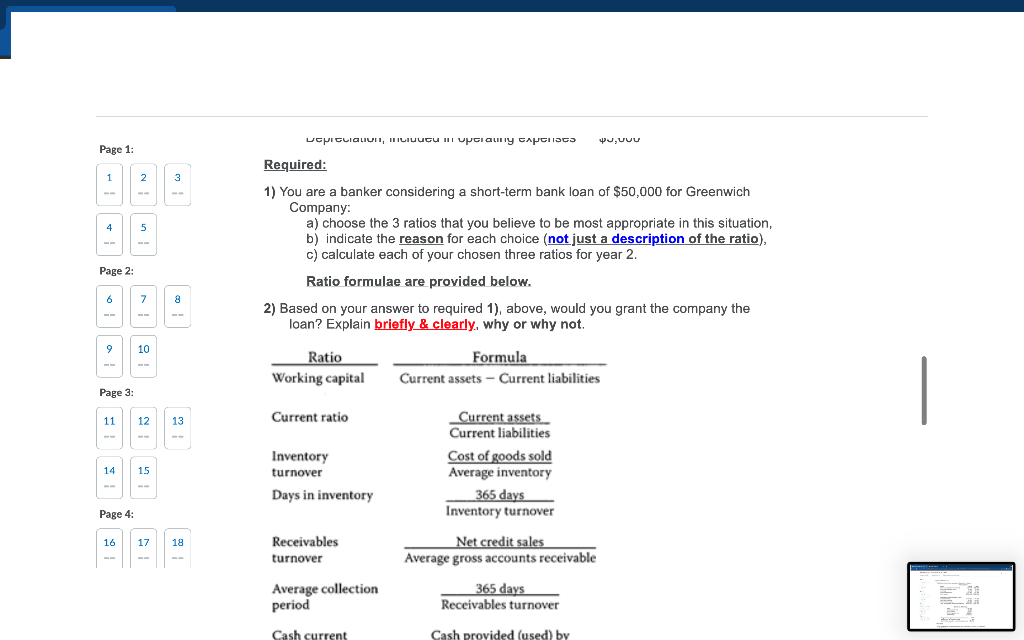
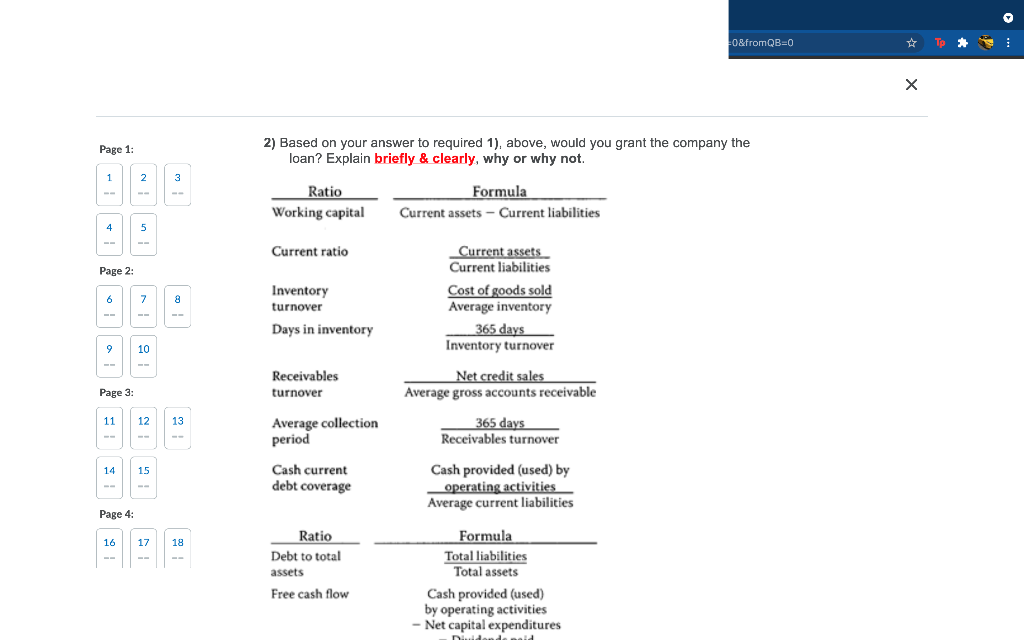
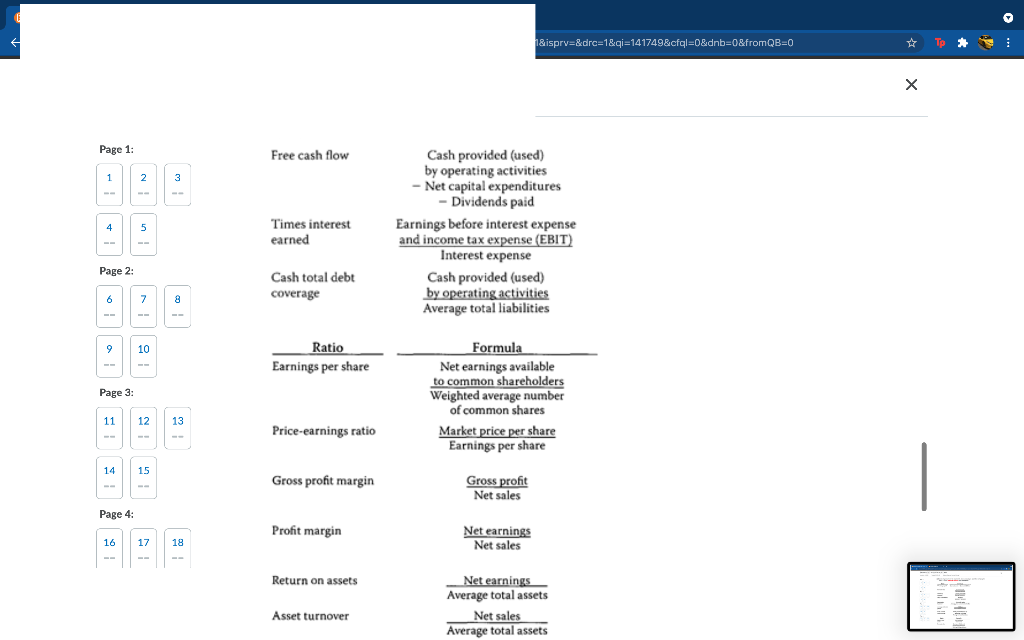
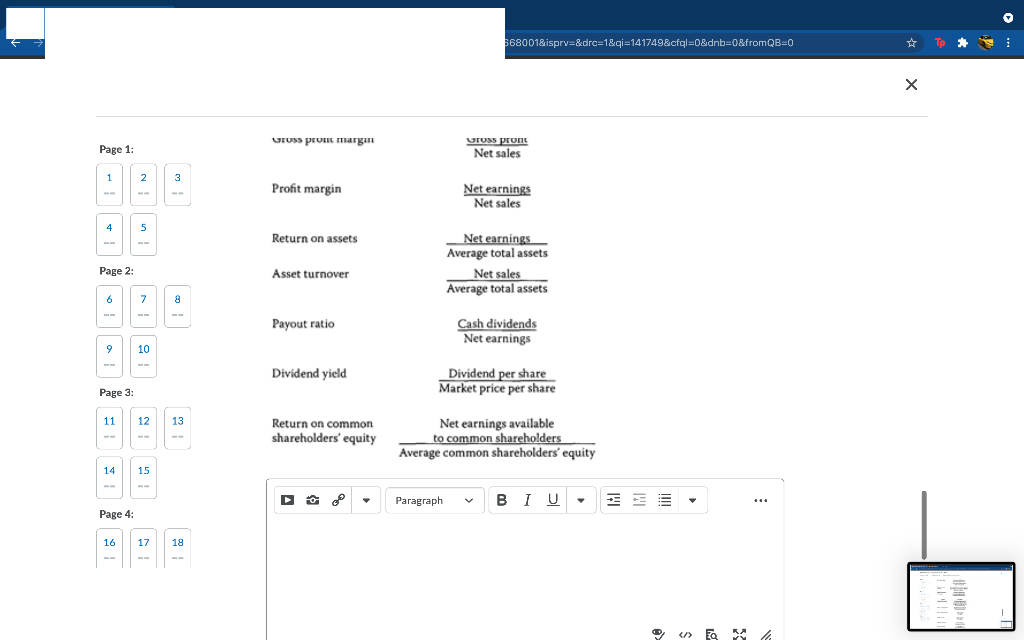
Page 1 1 2 3 4. 5 Question 24 (10 points) The following information pertains to Greenwich Company. Balance Sheet Assets Year 2 Year 1 Cash and short-term investments $ 45,000 $35,000 Accounts receivable (net) 25,000 25,000 Inventory 20,000 20,000 Capital Assets (net) 210,000 215,000 Total Assets $300,000 $295,000 Page 2: 6 7 8 9 10 Liabilities and Shareholders' Equity. Current liabilities Long-term liabilities Shareholders' equity Total liabilities and shareholders' equity $ 60,000 $70,000 90,000 90,000 150,000 135.000 $300,000 $295,000 Page 3: 11 12 13 Statement of Earnings Sales $ 80,000 Cost of goods sold 45,000 Gross margin 35,000 Operating expenses 20.000 Net earnings $ 15,000 14 15 Page 4: 16 17 Weighted average number of common shares 6,000 Market price per common share $20 Depreciation, included in operating expenses $5,000 Required: 1) You are a banker considering a short-term bank loan of $50,000 for Greenwich Company: , 9 , Page 1: 1 2 3 4. 5 Required: 1) You are a banker considering a short-term bank loan of $50,000 for Greenwich Company: a) choose the 3 ratios that you believe to be most appropriate in this situation, b) indicate the reason for each choice (not just a description of the ratio), c) calculate each of your chosen three ratios for year 2. Ratio formulae are provided below. 2) Based on your answer to required 1), above, would you grant the company the loan? Explain briefly & clearly, why or why not. Page 2 6 7 8 9 10 Ratio Working capital Formula Current assets - Current liabilities Page 3: 11 12 13 Current ratio Current assets Current liabilities Cost of goods sold Average inventory 365 days Inventory turnover 14 Inventory turnover Days in inventory 15 Page 4: 16 17 19 Net credit sales Average gross accounts receivable Receivables turnover Average collection period 365 days Receivables turnover Cash current Cash provided (used) by 1&isprv=&drc=1&qi=141749&cfql=0&dnb=0&fromQB=0 TO X Page 1 Free cash flow 1 2 3 4. 5 Times interest earned Cash provided (used) by operating activities - Net capital expenditures - Dividends paid Earnings before interest expense and income tax expense (EBIT) Interest expense Cash provided (used) by operating activities Average total liabilities Page 2: Cash total debt coverage 6 7 8 9 10 Ratio Earnings per share Page 3: Formula Net earnings available to common shareholders Weighted average number of common shares Market price per share Earnings per share 11 12 13 Price-earnings ratio 14 15 Gross profit margin Gross profit Net sales Page 4: Profit margin 16 Net earnings Net sales 17 Return on assets Net earnings Average total assets Net sales Average total assets Asset turnover 368001&isprv=&drc=1&i=141749&cfql=0&dnb=0&fromQB=0 TO X r Page 1 sus prorit Net sales 1 2 3 3 Profit margin Net earnings Net sales 4. 5 Return on assets Page 2 Net earnings Average total assets Net sales Average total assets Asset turnover 6 7 8 Payout ratio Cash dividends Net earnings 9 10 Dividend yield Dividend per share Market price per share Page 3: 11 12 13 Return on common shareholders' equity Net earnings available to common shareholders Average common shareholders' equity 14 15 Paragraph BIU- Page 4: 16 17 19 16 EO KA th Page 1 1 2 3 4. 5 Question 24 (10 points) The following information pertains to Greenwich Company. Balance Sheet Assets Year 2 Year 1 Cash and short-term investments $ 45,000 $35,000 Accounts receivable (net) 25,000 25,000 Inventory 20,000 20,000 Capital Assets (net) 210,000 215,000 Total Assets $300,000 $295,000 Page 2: 6 7 8 9 10 Liabilities and Shareholders' Equity. Current liabilities Long-term liabilities Shareholders' equity Total liabilities and shareholders' equity $ 60,000 $70,000 90,000 90,000 150,000 135.000 $300,000 $295,000 Page 3: 11 12 13 Statement of Earnings Sales $ 80,000 Cost of goods sold 45,000 Gross margin 35,000 Operating expenses 20.000 Net earnings $ 15,000 14 15 Page 4: 16 17 Weighted average number of common shares 6,000 Market price per common share $20 Depreciation, included in operating expenses $5,000 Required: 1) You are a banker considering a short-term bank loan of $50,000 for Greenwich Company: , 9 , Page 1: 1 2 3 4. 5 Required: 1) You are a banker considering a short-term bank loan of $50,000 for Greenwich Company: a) choose the 3 ratios that you believe to be most appropriate in this situation, b) indicate the reason for each choice (not just a description of the ratio), c) calculate each of your chosen three ratios for year 2. Ratio formulae are provided below. 2) Based on your answer to required 1), above, would you grant the company the loan? Explain briefly & clearly, why or why not. Page 2 6 7 8 9 10 Ratio Working capital Formula Current assets - Current liabilities Page 3: 11 12 13 Current ratio Current assets Current liabilities Cost of goods sold Average inventory 365 days Inventory turnover 14 Inventory turnover Days in inventory 15 Page 4: 16 17 19 Net credit sales Average gross accounts receivable Receivables turnover Average collection period 365 days Receivables turnover Cash current Cash provided (used) by 1&isprv=&drc=1&qi=141749&cfql=0&dnb=0&fromQB=0 TO X Page 1 Free cash flow 1 2 3 4. 5 Times interest earned Cash provided (used) by operating activities - Net capital expenditures - Dividends paid Earnings before interest expense and income tax expense (EBIT) Interest expense Cash provided (used) by operating activities Average total liabilities Page 2: Cash total debt coverage 6 7 8 9 10 Ratio Earnings per share Page 3: Formula Net earnings available to common shareholders Weighted average number of common shares Market price per share Earnings per share 11 12 13 Price-earnings ratio 14 15 Gross profit margin Gross profit Net sales Page 4: Profit margin 16 Net earnings Net sales 17 Return on assets Net earnings Average total assets Net sales Average total assets Asset turnover 368001&isprv=&drc=1&i=141749&cfql=0&dnb=0&fromQB=0 TO X r Page 1 sus prorit Net sales 1 2 3 3 Profit margin Net earnings Net sales 4. 5 Return on assets Page 2 Net earnings Average total assets Net sales Average total assets Asset turnover 6 7 8 Payout ratio Cash dividends Net earnings 9 10 Dividend yield Dividend per share Market price per share Page 3: 11 12 13 Return on common shareholders' equity Net earnings available to common shareholders Average common shareholders' equity 14 15 Paragraph BIU- Page 4: 16 17 19 16 EO KA th
Step by Step Solution
There are 3 Steps involved in it

Get step-by-step solutions from verified subject matter experts