

Question: The pie chart shows the responses of a sample of 333 small business owners who were asked whether their business has a website. Fine

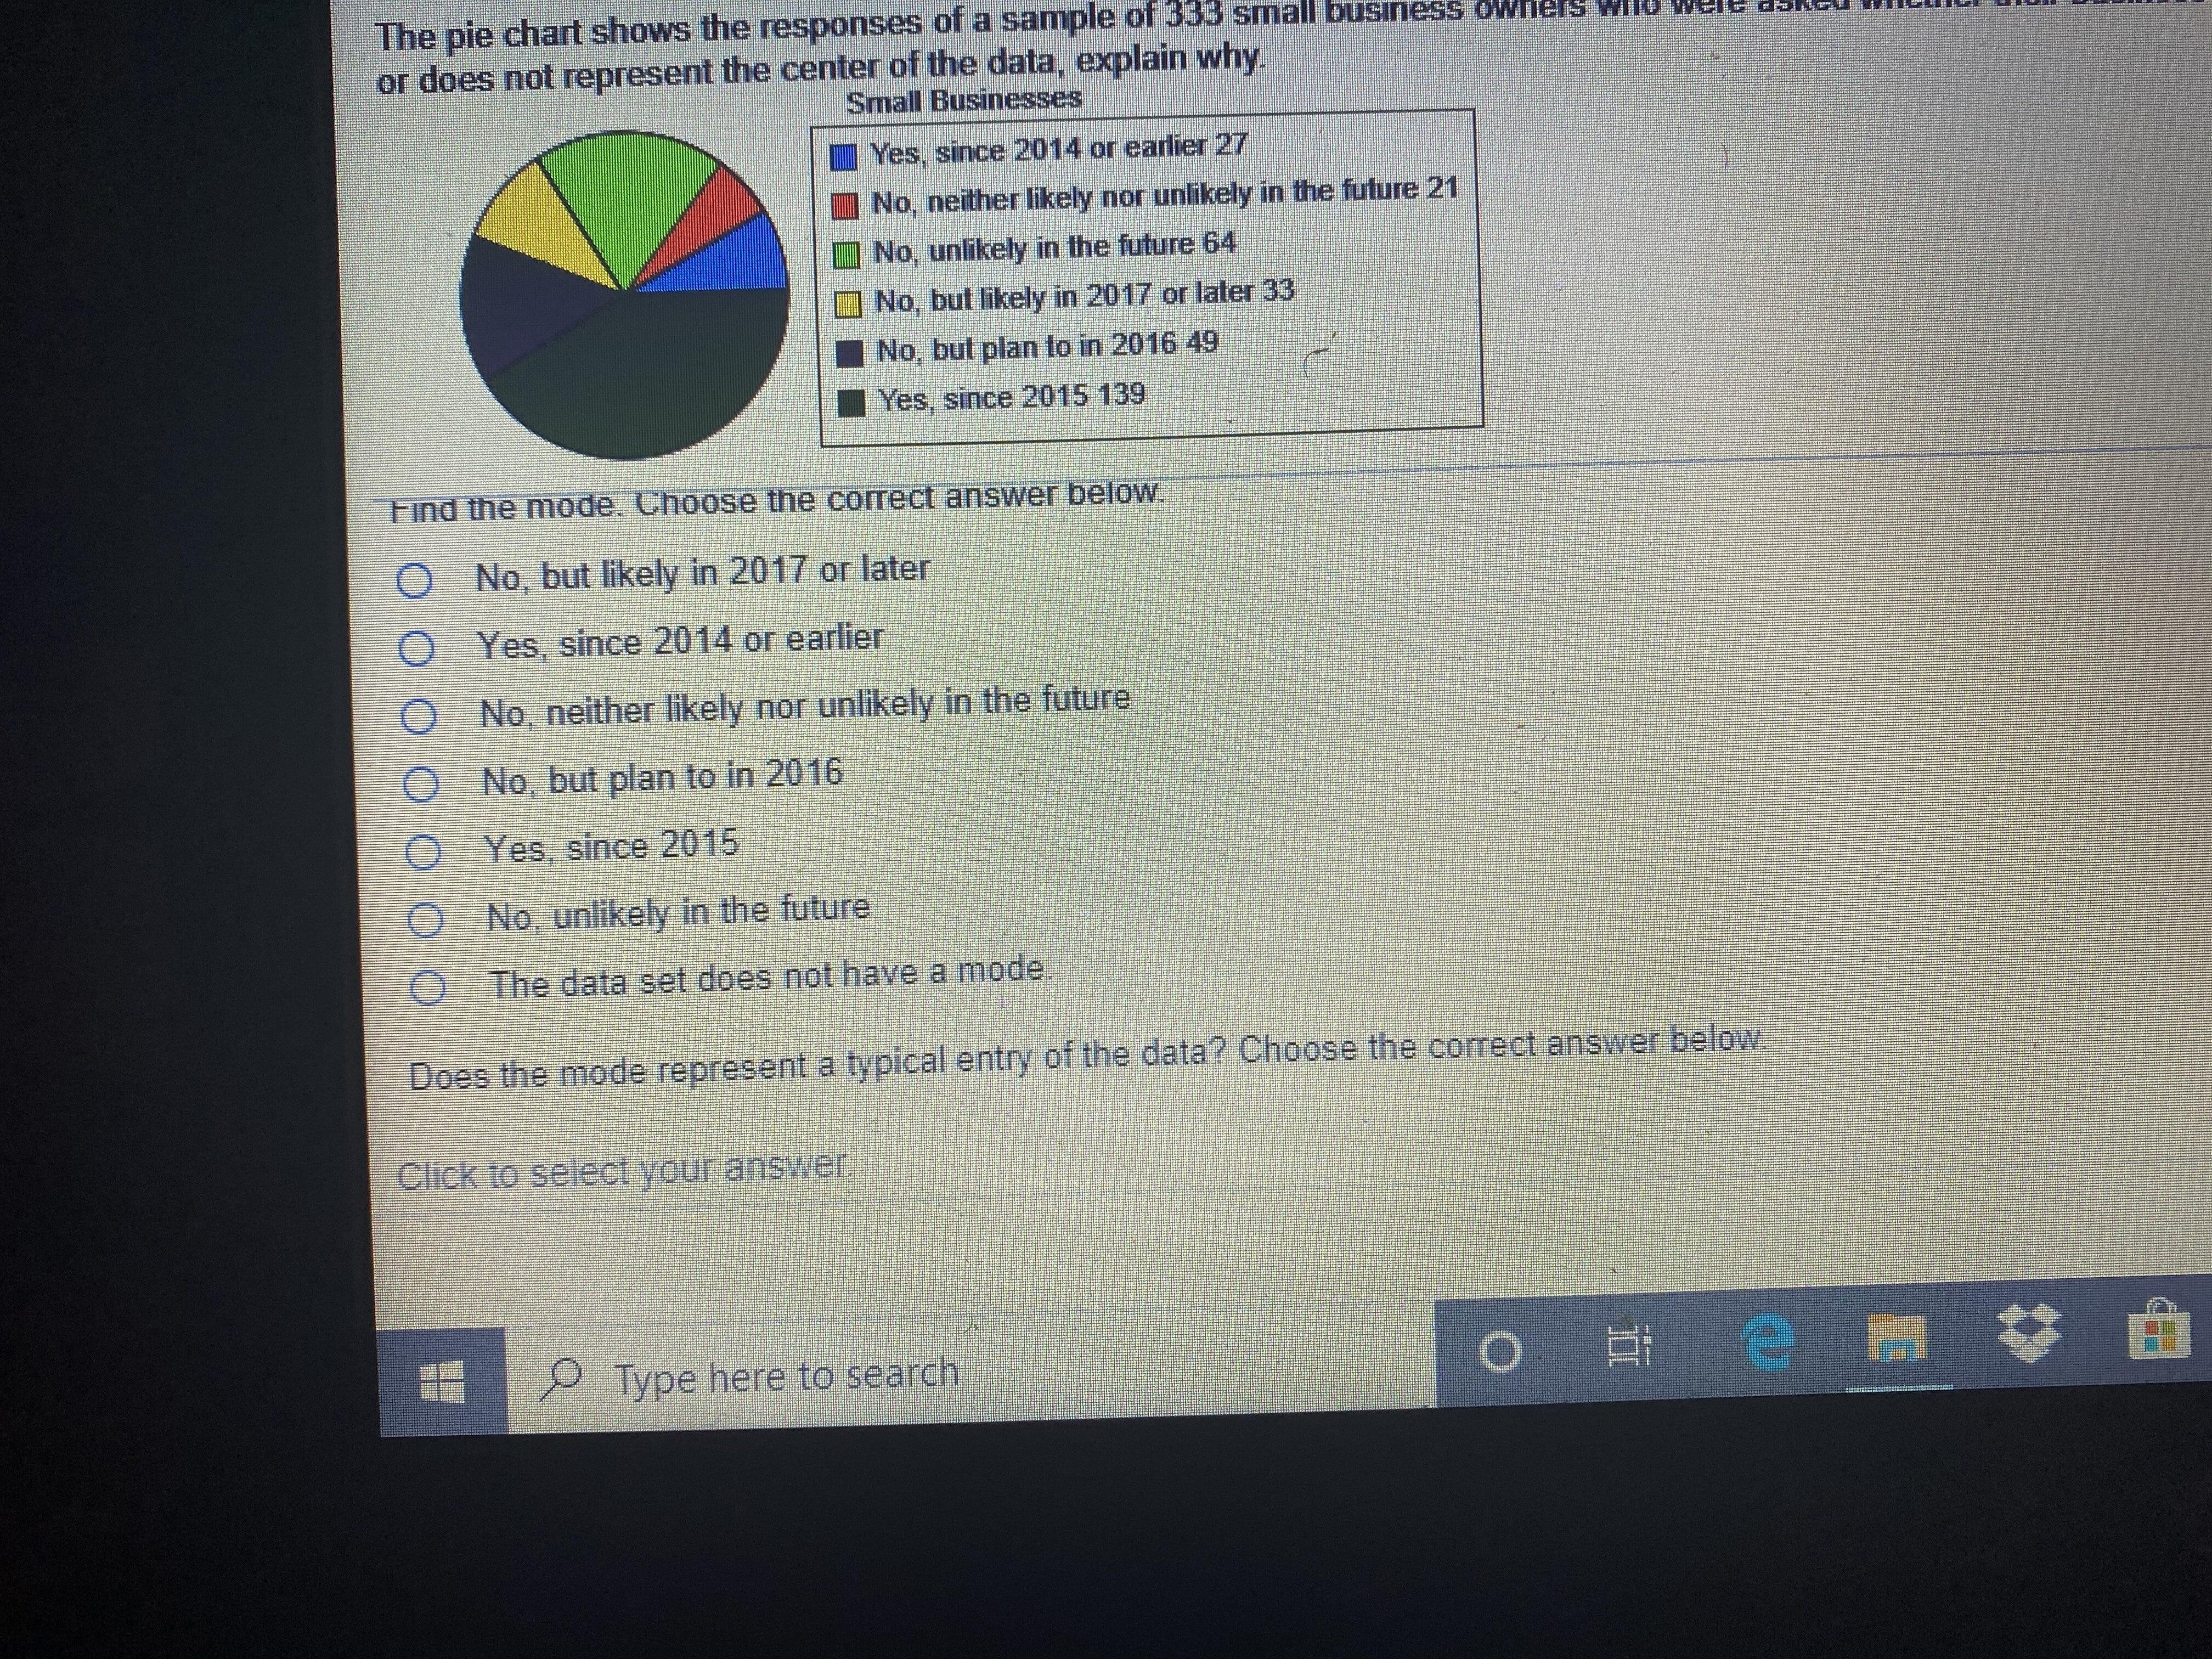
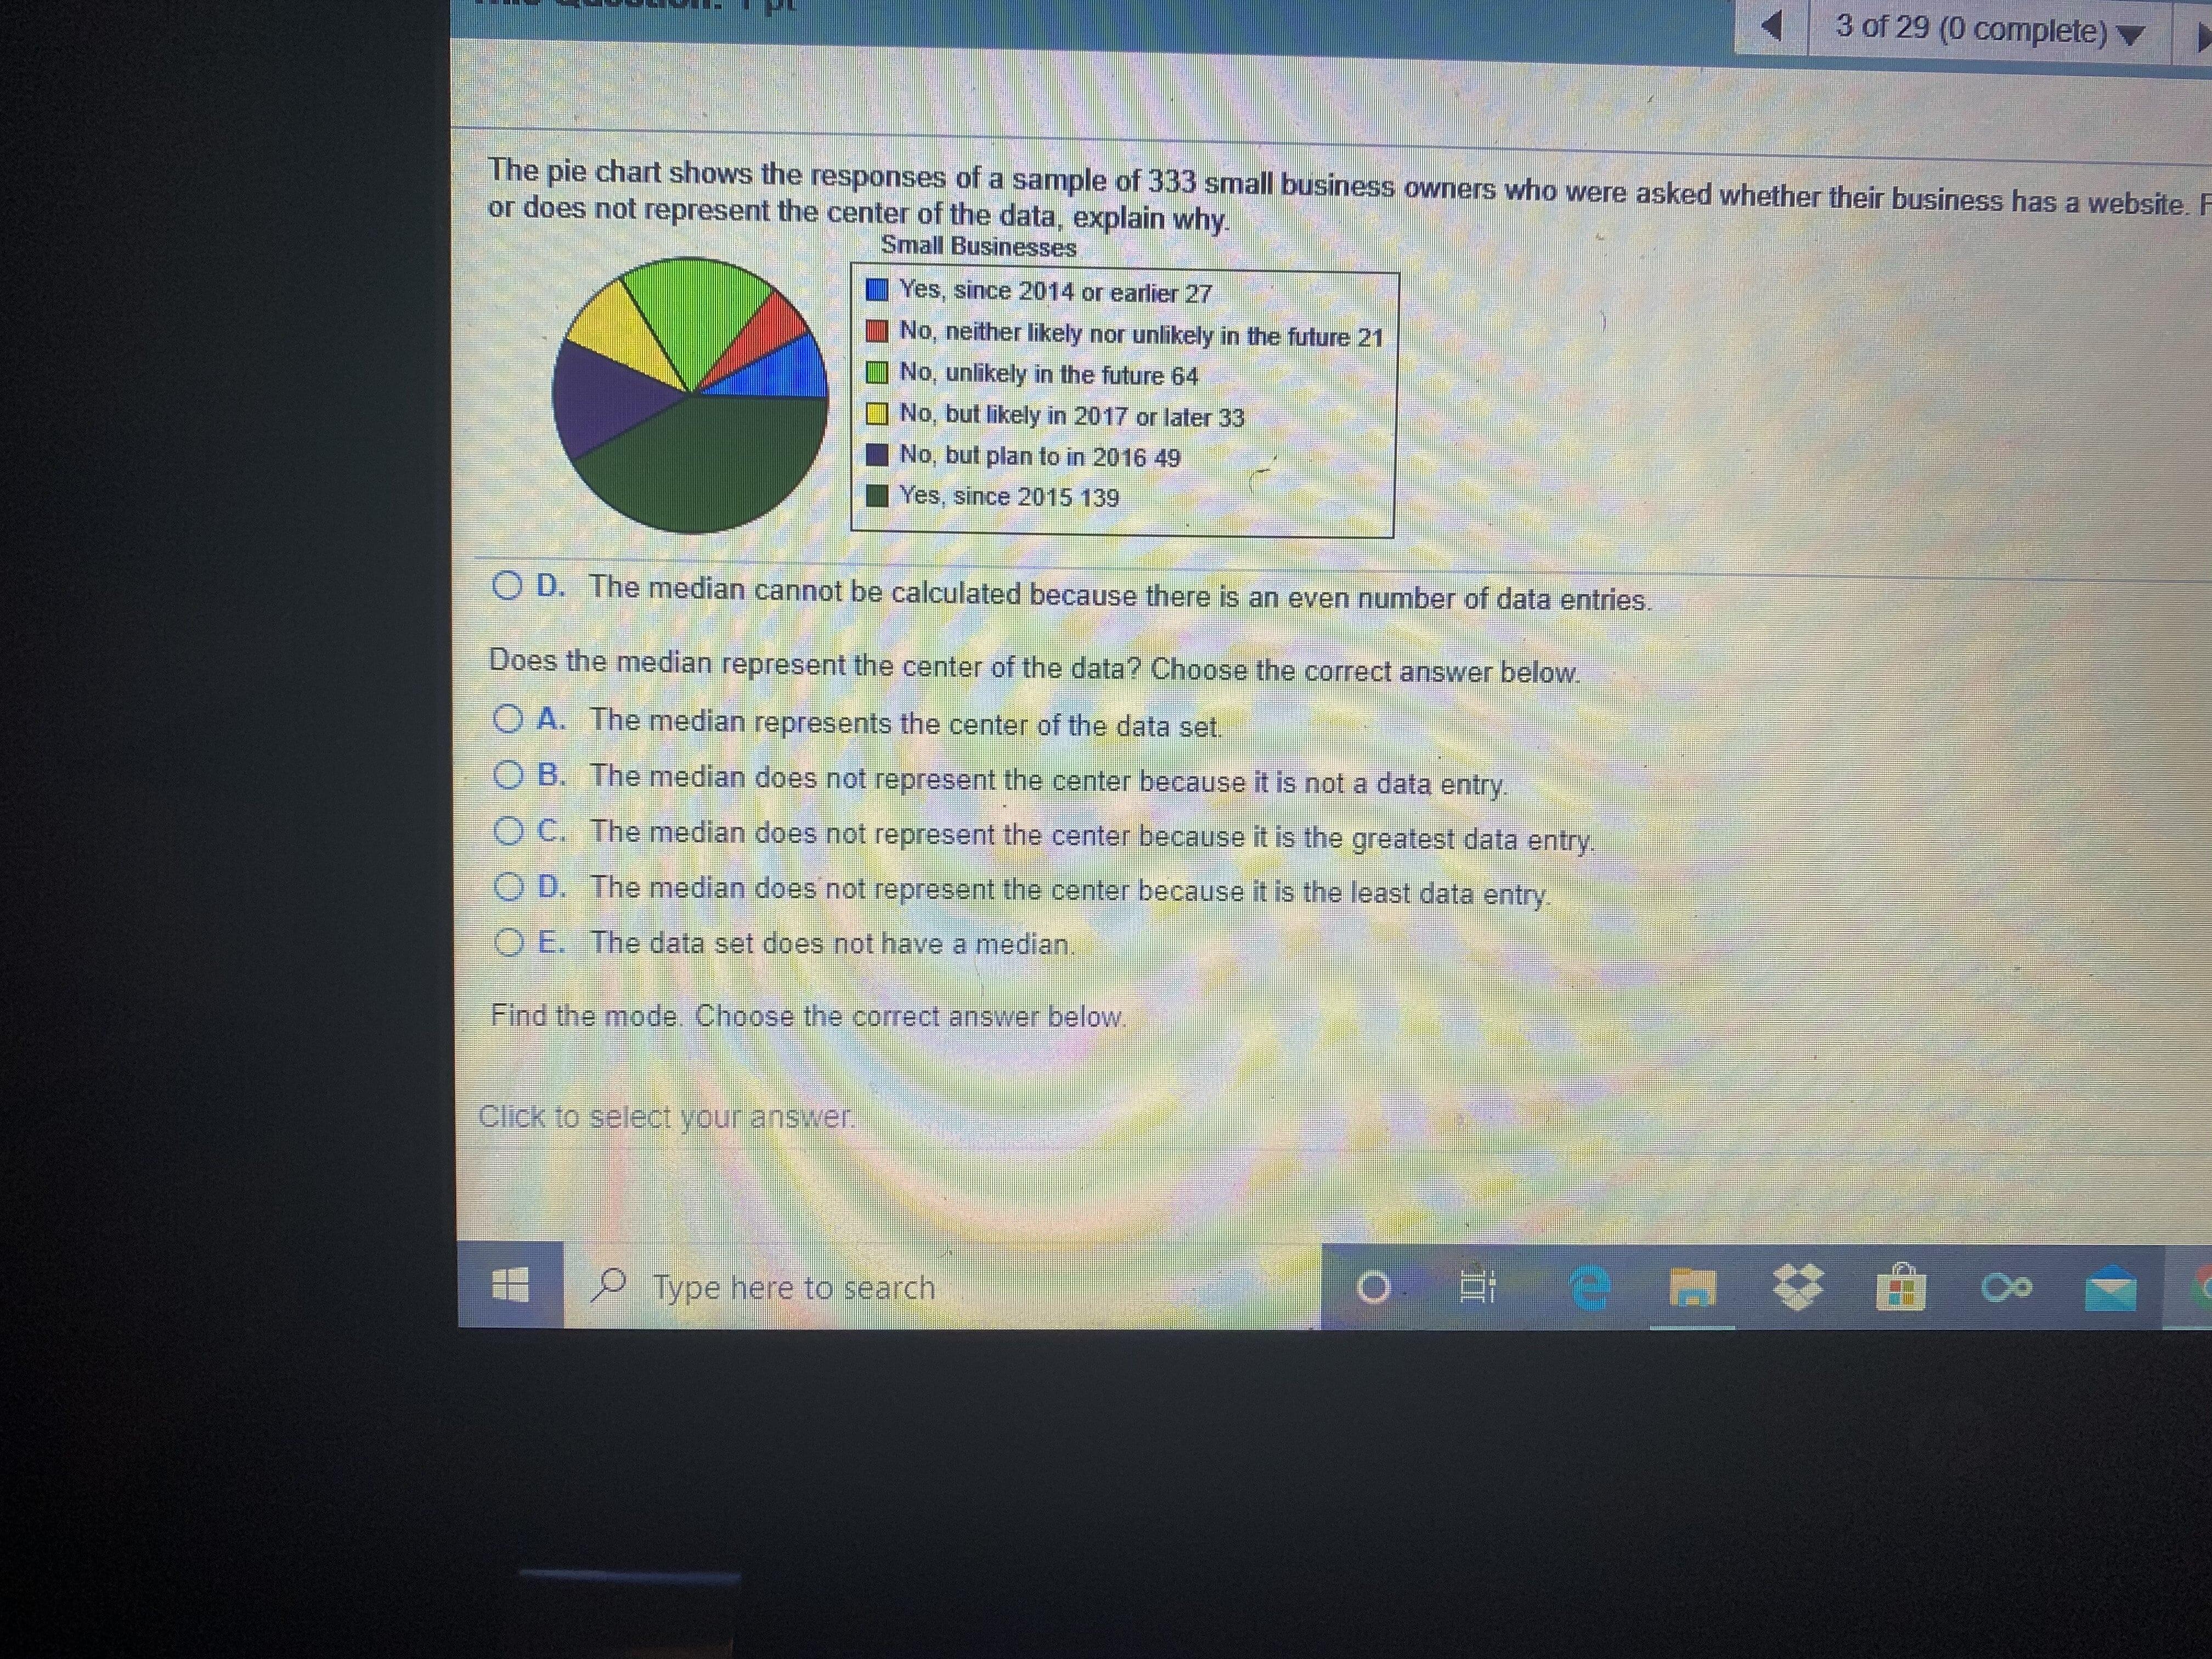
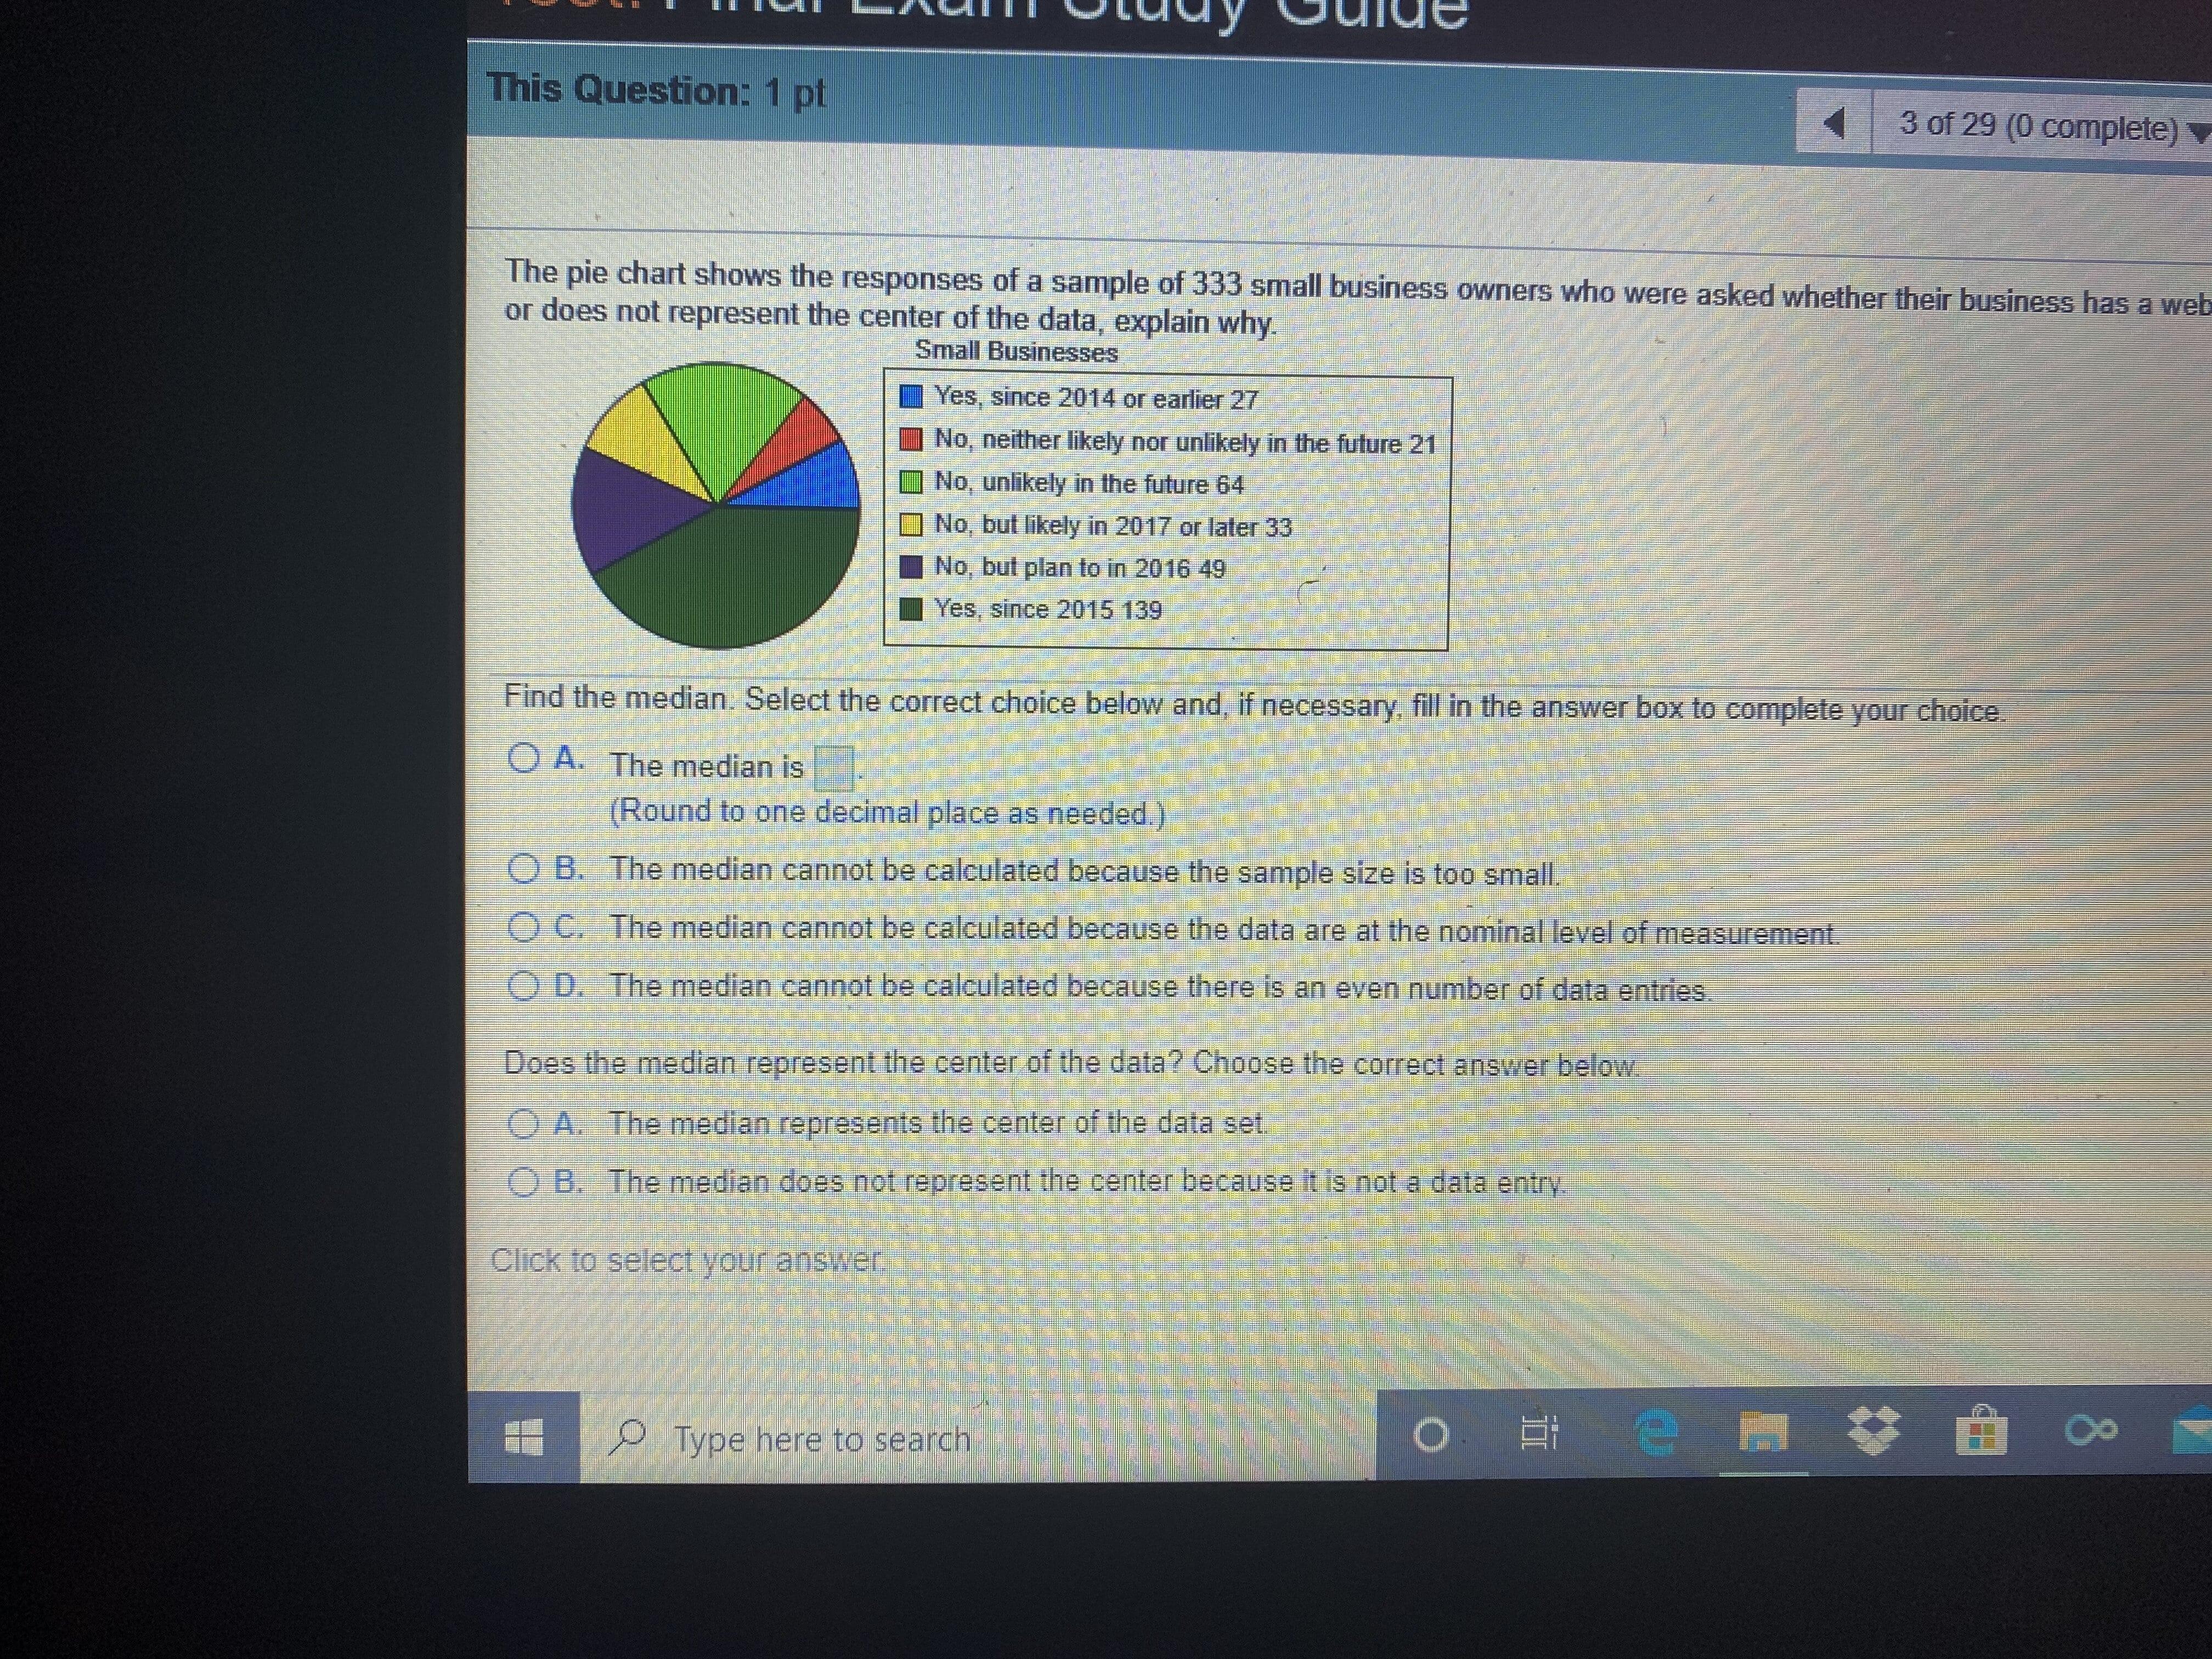


The pie chart shows the responses of a sample of 333 small business owners who were asked whether their business has a website. Fine or does not represent the center of the data, explain why. Small Businesses Yes, since 2014 or earlier 27 No, neither likely nor unlikely in the future 21 No, unlikely in the future 64 O No, but likely in 2017 or later 33 No, but plan to in 2016 49 Yes, since 2015 139 O No, unlikely in the future O The data set does not have a mode. Does the mode represent a typical entry of the data? Choose the correct answer below. O A. The mode represents a typical entry of the data set. B. The mode does not represent the center because it is not a data entry. O C. The mode does not represent the center because it is the last data entry in the table. O D. The mode does not represent the center because it is the first data entry in the table. E. The data set does not have a mode. O OII The pie chart shows the responses of a sample of 333 small business owners WIIO W or does not represent the center of the data, explain why. Small Businesses Yes, since 2014 or earlier 27 No, neither likely nor unlikely in the future 21 No, unlikely in the future 64 No, but likely in 2017 or later 33 No, but plan to in 2016 49 I Yes, since 2015 139 Find the mode. Choose the corect answer below. O No, but likely in 2017 or later O Yes, since 2014 or earlier O No, neither likely nor unlikely in the future No, but plan to in 2016 Yes, since 2015 No, unlikely in the future The data set does not have a model Does the mode represent a typical entry of the data? Choose the correct answer below Click to selectyour answer Type here to search N # 3 of 29 (0 complete) The pie chart shows the responses of a sample of 333 small business owners who were asked whether their business has a website. F or does not represent the center of the data, explain why. Small Businesses Yes, since 2014 or earlier 27 No, neither likely nor unlikely in the future 21 No, unlikely in the future 64 No, but likely in 2017 or later 33 No, but plan to in 2016 49 Yes, since 2015 139 O D. The median cannot be calculated because there is an even number of data entries. Does the median represent the center of the data? Choose the correct answer below. O A. The median represents the center of the data set. O B. The median does not represent the center because it is not a data entry. O C. The median does not represent the center because it is the greatest data entry. O D. The median does not represent the center because it is the least data entry. O E. The data set does not have a median, Find the mode. Choose the correct answer below. Click to select your answer. Type here to search 88 This Question: 1 pt 3 of 29 (0 complete) The pie chart shows the responses of a sample of 333 small business owners who were asked whether their business has a web or does not represent the center of the data, explain why. Small Businesses Yes, since 2014 or earlier 27 No, neither likely nor unlikely in the future 21 No, unlikely in the future 64 No, but likely in 2017 or later 33 No, but plan to in 2016 49 Yes, since 2015 139 Find the median. Select the correct choice below and, if necessary, fill in the answer box to complete your choice. O A. The median is (Round to one decimal place as needed.) O B. The median cannot be calculated because the sample size is too small. OC. The median cannot be calculated because the data are at the nominal level of measurement, O D. The median cannot be calculated because there is an even number of data entries. Does the medlan represent the center of the data? Choose the correct answer below O A. The median represents the center of the data set. O B. The median does not represent the center because it is not a data entry. Click to select your answer. O Type here to search 88 Ludent/Playerlest.aspxrtestid%3D214985817 &lcen terwin%3Dyes SMAT 130B Section 08 Test: Final Exam Study Guide This Question: 1 pt 3 of 29 (0 complete) The pie chart shows the responses of a sample of 333 small business owners who were asked whether their business has a website. Find the mean, the median, and the mode or does not represent the center of the data, explain why Small Businesses Yes, since 2014 or earlier 27 No, neither likely nor unlikely in the future 21 No, unlikely in the future 64 O No, but likely in 2017 or later 33 No, but plan to in 2016 49 Yes, since 2015 139 Does the mean represent the center of the data? Choose the correct answer below. O A. The mean represents the center of the data set. O B. The mean does not represent the center because it is not a data entry O C. The mean does not represent the center because it is the least data entry. O D. The mean does not represent the center because it is the greatest data entry CEThe data set does not have a mean. Find the median Select the correct choice below and. if necessary fill in the answer box to complete your choice OA. The median is (Round to one decimal place as needed.) Click to select your answer. 8. Ps N PType here to search SMAT 130B Section 08 Adedapo Ogunba & 04/23/20 7:55 PM Submit Test Test: Final Exam Study Guide 3 of 29 (0 complete) This Test: 29 pts possible This Question: 1 pt The pie chart shows the responses of a sample of 333 small business owners who were asked whether their business has a website. Find the mean, thlmedian, and the mode of the data, if possible. If any measure cannot be found or does not represent the center of the data, explain why. Small Businesses Yes, since 2014 or earlier 27 No, neither likely nor unlikely in the future 21 No, unlikely in the future 64 No, but likely in 2017 or later 33 No, but plan to in 2016 49 Yes, since 2015 139 Find the mean. Select the correct choice below and, if necessary, fill in the answer box to complete your choice. O A. The mean is (Round to one decimal place as needed) O B. The mean cannot be calculated because the data are at the nominal level of measurement. O C. The mean cannot be calculated because the sample size is too small. O D. The mean cannot be calculated because there is an even number of data entries. Does the mean represent the center of the data? Choose the correct answer below. O A. The mean represents the center of the data set. The moan doos not ronrocont the conter hecau1ce it ic nnt a data antry Click to select your answer. 855 PM Ps 4/23/2020 20 O Type here to search 8. 00 The pie chart shows the responses of a sample of 333 small business owners who were asked whether their business has a website. Fine or does not represent the center of the data, explain why. Small Businesses Yes, since 2014 or earlier 27 No, neither likely nor unlikely in the future 21 No, unlikely in the future 64 O No, but likely in 2017 or later 33 No, but plan to in 2016 49 Yes, since 2015 139 O No, unlikely in the future O The data set does not have a mode. Does the mode represent a typical entry of the data? Choose the correct answer below. O A. The mode represents a typical entry of the data set. B. The mode does not represent the center because it is not a data entry. O C. The mode does not represent the center because it is the last data entry in the table. O D. The mode does not represent the center because it is the first data entry in the table. E. The data set does not have a mode. O OII The pie chart shows the responses of a sample of 333 small business owners WIIO W or does not represent the center of the data, explain why. Small Businesses Yes, since 2014 or earlier 27 No, neither likely nor unlikely in the future 21 No, unlikely in the future 64 No, but likely in 2017 or later 33 No, but plan to in 2016 49 I Yes, since 2015 139 Find the mode. Choose the corect answer below. O No, but likely in 2017 or later O Yes, since 2014 or earlier O No, neither likely nor unlikely in the future No, but plan to in 2016 Yes, since 2015 No, unlikely in the future The data set does not have a model Does the mode represent a typical entry of the data? Choose the correct answer below Click to selectyour answer Type here to search N # 3 of 29 (0 complete) The pie chart shows the responses of a sample of 333 small business owners who were asked whether their business has a website. F or does not represent the center of the data, explain why. Small Businesses Yes, since 2014 or earlier 27 No, neither likely nor unlikely in the future 21 No, unlikely in the future 64 No, but likely in 2017 or later 33 No, but plan to in 2016 49 Yes, since 2015 139 O D. The median cannot be calculated because there is an even number of data entries. Does the median represent the center of the data? Choose the correct answer below. O A. The median represents the center of the data set. O B. The median does not represent the center because it is not a data entry. O C. The median does not represent the center because it is the greatest data entry. O D. The median does not represent the center because it is the least data entry. O E. The data set does not have a median, Find the mode. Choose the correct answer below. Click to select your answer. Type here to search 88 This Question: 1 pt 3 of 29 (0 complete) The pie chart shows the responses of a sample of 333 small business owners who were asked whether their business has a web or does not represent the center of the data, explain why. Small Businesses Yes, since 2014 or earlier 27 No, neither likely nor unlikely in the future 21 No, unlikely in the future 64 No, but likely in 2017 or later 33 No, but plan to in 2016 49 Yes, since 2015 139 Find the median. Select the correct choice below and, if necessary, fill in the answer box to complete your choice. O A. The median is (Round to one decimal place as needed.) O B. The median cannot be calculated because the sample size is too small. OC. The median cannot be calculated because the data are at the nominal level of measurement, O D. The median cannot be calculated because there is an even number of data entries. Does the medlan represent the center of the data? Choose the correct answer below O A. The median represents the center of the data set. O B. The median does not represent the center because it is not a data entry. Click to select your answer. O Type here to search 88 Ludent/Playerlest.aspxrtestid%3D214985817 &lcen terwin%3Dyes SMAT 130B Section 08 Test: Final Exam Study Guide This Question: 1 pt 3 of 29 (0 complete) The pie chart shows the responses of a sample of 333 small business owners who were asked whether their business has a website. Find the mean, the median, and the mode or does not represent the center of the data, explain why Small Businesses Yes, since 2014 or earlier 27 No, neither likely nor unlikely in the future 21 No, unlikely in the future 64 O No, but likely in 2017 or later 33 No, but plan to in 2016 49 Yes, since 2015 139 Does the mean represent the center of the data? Choose the correct answer below. O A. The mean represents the center of the data set. O B. The mean does not represent the center because it is not a data entry O C. The mean does not represent the center because it is the least data entry. O D. The mean does not represent the center because it is the greatest data entry CEThe data set does not have a mean. Find the median Select the correct choice below and. if necessary fill in the answer box to complete your choice OA. The median is (Round to one decimal place as needed.) Click to select your answer. 8. Ps N PType here to search SMAT 130B Section 08 Adedapo Ogunba & 04/23/20 7:55 PM Submit Test Test: Final Exam Study Guide 3 of 29 (0 complete) This Test: 29 pts possible This Question: 1 pt The pie chart shows the responses of a sample of 333 small business owners who were asked whether their business has a website. Find the mean, thlmedian, and the mode of the data, if possible. If any measure cannot be found or does not represent the center of the data, explain why. Small Businesses Yes, since 2014 or earlier 27 No, neither likely nor unlikely in the future 21 No, unlikely in the future 64 No, but likely in 2017 or later 33 No, but plan to in 2016 49 Yes, since 2015 139 Find the mean. Select the correct choice below and, if necessary, fill in the answer box to complete your choice. O A. The mean is (Round to one decimal place as needed) O B. The mean cannot be calculated because the data are at the nominal level of measurement. O C. The mean cannot be calculated because the sample size is too small. O D. The mean cannot be calculated because there is an even number of data entries. Does the mean represent the center of the data? Choose the correct answer below. O A. The mean represents the center of the data set. The moan doos not ronrocont the conter hecau1ce it ic nnt a data antry Click to select your answer. 855 PM Ps 4/23/2020 20 O Type here to search 8. 00 The pie chart shows the responses of a sample of 333 small business owners who were asked whether their business has a website. Fine or does not represent the center of the data, explain why. Small Businesses Yes, since 2014 or earlier 27 No, neither likely nor unlikely in the future 21 No, unlikely in the future 64 O No, but likely in 2017 or later 33 No, but plan to in 2016 49 Yes, since 2015 139 O No, unlikely in the future O The data set does not have a mode. Does the mode represent a typical entry of the data? Choose the correct answer below. O A. The mode represents a typical entry of the data set. B. The mode does not represent the center because it is not a data entry. O C. The mode does not represent the center because it is the last data entry in the table. O D. The mode does not represent the center because it is the first data entry in the table. E. The data set does not have a mode. O OII The pie chart shows the responses of a sample of 333 small business owners WIIO W or does not represent the center of the data, explain why. Small Businesses Yes, since 2014 or earlier 27 No, neither likely nor unlikely in the future 21 No, unlikely in the future 64 No, but likely in 2017 or later 33 No, but plan to in 2016 49 I Yes, since 2015 139 Find the mode. Choose the corect answer below. O No, but likely in 2017 or later O Yes, since 2014 or earlier O No, neither likely nor unlikely in the future No, but plan to in 2016 Yes, since 2015 No, unlikely in the future The data set does not have a model Does the mode represent a typical entry of the data? Choose the correct answer below Click to selectyour answer Type here to search N # 3 of 29 (0 complete) The pie chart shows the responses of a sample of 333 small business owners who were asked whether their business has a website. F or does not represent the center of the data, explain why. Small Businesses Yes, since 2014 or earlier 27 No, neither likely nor unlikely in the future 21 No, unlikely in the future 64 No, but likely in 2017 or later 33 No, but plan to in 2016 49 Yes, since 2015 139 O D. The median cannot be calculated because there is an even number of data entries. Does the median represent the center of the data? Choose the correct answer below. O A. The median represents the center of the data set. O B. The median does not represent the center because it is not a data entry. O C. The median does not represent the center because it is the greatest data entry. O D. The median does not represent the center because it is the least data entry. O E. The data set does not have a median, Find the mode. Choose the correct answer below. Click to select your answer. Type here to search 88 This Question: 1 pt 3 of 29 (0 complete) The pie chart shows the responses of a sample of 333 small business owners who were asked whether their business has a web or does not represent the center of the data, explain why. Small Businesses Yes, since 2014 or earlier 27 No, neither likely nor unlikely in the future 21 No, unlikely in the future 64 No, but likely in 2017 or later 33 No, but plan to in 2016 49 Yes, since 2015 139 Find the median. Select the correct choice below and, if necessary, fill in the answer box to complete your choice. O A. The median is (Round to one decimal place as needed.) O B. The median cannot be calculated because the sample size is too small. OC. The median cannot be calculated because the data are at the nominal level of measurement, O D. The median cannot be calculated because there is an even number of data entries. Does the medlan represent the center of the data? Choose the correct answer below O A. The median represents the center of the data set. O B. The median does not represent the center because it is not a data entry. Click to select your answer. O Type here to search 88 Ludent/Playerlest.aspxrtestid%3D214985817 &lcen terwin%3Dyes SMAT 130B Section 08 Test: Final Exam Study Guide This Question: 1 pt 3 of 29 (0 complete) The pie chart shows the responses of a sample of 333 small business owners who were asked whether their business has a website. Find the mean, the median, and the mode or does not represent the center of the data, explain why Small Businesses Yes, since 2014 or earlier 27 No, neither likely nor unlikely in the future 21 No, unlikely in the future 64 O No, but likely in 2017 or later 33 No, but plan to in 2016 49 Yes, since 2015 139 Does the mean represent the center of the data? Choose the correct answer below. O A. The mean represents the center of the data set. O B. The mean does not represent the center because it is not a data entry O C. The mean does not represent the center because it is the least data entry. O D. The mean does not represent the center because it is the greatest data entry CEThe data set does not have a mean. Find the median Select the correct choice below and. if necessary fill in the answer box to complete your choice OA. The median is (Round to one decimal place as needed.) Click to select your answer. 8. Ps N PType here to search SMAT 130B Section 08 Adedapo Ogunba & 04/23/20 7:55 PM Submit Test Test: Final Exam Study Guide 3 of 29 (0 complete) This Test: 29 pts possible This Question: 1 pt The pie chart shows the responses of a sample of 333 small business owners who were asked whether their business has a website. Find the mean, thlmedian, and the mode of the data, if possible. If any measure cannot be found or does not represent the center of the data, explain why. Small Businesses Yes, since 2014 or earlier 27 No, neither likely nor unlikely in the future 21 No, unlikely in the future 64 No, but likely in 2017 or later 33 No, but plan to in 2016 49 Yes, since 2015 139 Find the mean. Select the correct choice below and, if necessary, fill in the answer box to complete your choice. O A. The mean is (Round to one decimal place as needed) O B. The mean cannot be calculated because the data are at the nominal level of measurement. O C. The mean cannot be calculated because the sample size is too small. O D. The mean cannot be calculated because there is an even number of data entries. Does the mean represent the center of the data? Choose the correct answer below. O A. The mean represents the center of the data set. The moan doos not ronrocont the conter hecau1ce it ic nnt a data antry Click to select your answer. 855 PM Ps 4/23/2020 20 O Type here to search 8. 00 The pie chart shows the responses of a sample of 333 small business owners who were asked whether their business has a website. Fine or does not represent the center of the data, explain why. Small Businesses Yes, since 2014 or earlier 27 No, neither likely nor unlikely in the future 21 No, unlikely in the future 64 O No, but likely in 2017 or later 33 No, but plan to in 2016 49 Yes, since 2015 139 O No, unlikely in the future O The data set does not have a mode. Does the mode represent a typical entry of the data? Choose the correct answer below. O A. The mode represents a typical entry of the data set. B. The mode does not represent the center because it is not a data entry. O C. The mode does not represent the center because it is the last data entry in the table. O D. The mode does not represent the center because it is the first data entry in the table. E. The data set does not have a mode. O OII The pie chart shows the responses of a sample of 333 small business owners WIIO W or does not represent the center of the data, explain why. Small Businesses Yes, since 2014 or earlier 27 No, neither likely nor unlikely in the future 21 No, unlikely in the future 64 No, but likely in 2017 or later 33 No, but plan to in 2016 49 I Yes, since 2015 139 Find the mode. Choose the corect answer below. O No, but likely in 2017 or later O Yes, since 2014 or earlier O No, neither likely nor unlikely in the future No, but plan to in 2016 Yes, since 2015 No, unlikely in the future The data set does not have a model Does the mode represent a typical entry of the data? Choose the correct answer below Click to selectyour answer Type here to search N # 3 of 29 (0 complete) The pie chart shows the responses of a sample of 333 small business owners who were asked whether their business has a website. F or does not represent the center of the data, explain why. Small Businesses Yes, since 2014 or earlier 27 No, neither likely nor unlikely in the future 21 No, unlikely in the future 64 No, but likely in 2017 or later 33 No, but plan to in 2016 49 Yes, since 2015 139 O D. The median cannot be calculated because there is an even number of data entries. Does the median represent the center of the data? Choose the correct answer below. O A. The median represents the center of the data set. O B. The median does not represent the center because it is not a data entry. O C. The median does not represent the center because it is the greatest data entry. O D. The median does not represent the center because it is the least data entry. O E. The data set does not have a median, Find the mode. Choose the correct answer below. Click to select your answer. Type here to search 88 This Question: 1 pt 3 of 29 (0 complete) The pie chart shows the responses of a sample of 333 small business owners who were asked whether their business has a web or does not represent the center of the data, explain why. Small Businesses Yes, since 2014 or earlier 27 No, neither likely nor unlikely in the future 21 No, unlikely in the future 64 No, but likely in 2017 or later 33 No, but plan to in 2016 49 Yes, since 2015 139 Find the median. Select the correct choice below and, if necessary, fill in the answer box to complete your choice. O A. The median is (Round to one decimal place as needed.) O B. The median cannot be calculated because the sample size is too small. OC. The median cannot be calculated because the data are at the nominal level of measurement, O D. The median cannot be calculated because there is an even number of data entries. Does the medlan represent the center of the data? Choose the correct answer below O A. The median represents the center of the data set. O B. The median does not represent the center because it is not a data entry. Click to select your answer. O Type here to search 88 Ludent/Playerlest.aspxrtestid%3D214985817 &lcen terwin%3Dyes SMAT 130B Section 08 Test: Final Exam Study Guide This Question: 1 pt 3 of 29 (0 complete) The pie chart shows the responses of a sample of 333 small business owners who were asked whether their business has a website. Find the mean, the median, and the mode or does not represent the center of the data, explain why Small Businesses Yes, since 2014 or earlier 27 No, neither likely nor unlikely in the future 21 No, unlikely in the future 64 O No, but likely in 2017 or later 33 No, but plan to in 2016 49 Yes, since 2015 139 Does the mean represent the center of the data? Choose the correct answer below. O A. The mean represents the center of the data set. O B. The mean does not represent the center because it is not a data entry O C. The mean does not represent the center because it is the least data entry. O D. The mean does not represent the center because it is the greatest data entry CEThe data set does not have a mean. Find the median Select the correct choice below and. if necessary fill in the answer box to complete your choice OA. The median is (Round to one decimal place as needed.) Click to select your answer. 8. Ps N PType here to search SMAT 130B Section 08 Adedapo Ogunba & 04/23/20 7:55 PM Submit Test Test: Final Exam Study Guide 3 of 29 (0 complete) This Test: 29 pts possible This Question: 1 pt The pie chart shows the responses of a sample of 333 small business owners who were asked whether their business has a website. Find the mean, thlmedian, and the mode of the data, if possible. If any measure cannot be found or does not represent the center of the data, explain why. Small Businesses Yes, since 2014 or earlier 27 No, neither likely nor unlikely in the future 21 No, unlikely in the future 64 No, but likely in 2017 or later 33 No, but plan to in 2016 49 Yes, since 2015 139 Find the mean. Select the correct choice below and, if necessary, fill in the answer box to complete your choice. O A. The mean is (Round to one decimal place as needed) O B. The mean cannot be calculated because the data are at the nominal level of measurement. O C. The mean cannot be calculated because the sample size is too small. O D. The mean cannot be calculated because there is an even number of data entries. Does the mean represent the center of the data? Choose the correct answer below. O A. The mean represents the center of the data set. The moan doos not ronrocont the conter hecau1ce it ic nnt a data antry Click to select your answer. 855 PM Ps 4/23/2020 20 O Type here to search 8. 00
Step by Step Solution
3.35 Rating (158 Votes )
There are 3 Steps involved in it
To solve the questions based on the pie chart lets analyze each part Finding the Mode The mode is th... View full answer

Get step-by-step solutions from verified subject matter experts