

Question: this is all the information I have Question Help (Selecting a benchmark company) Here you will find the income statements and balance sheets for Sears
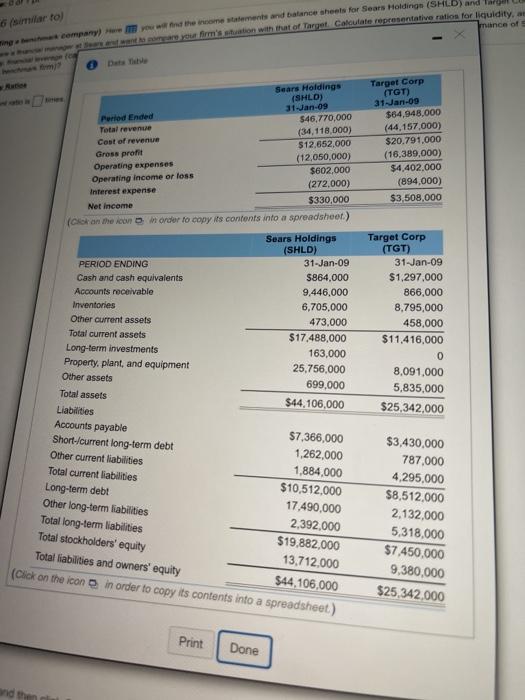
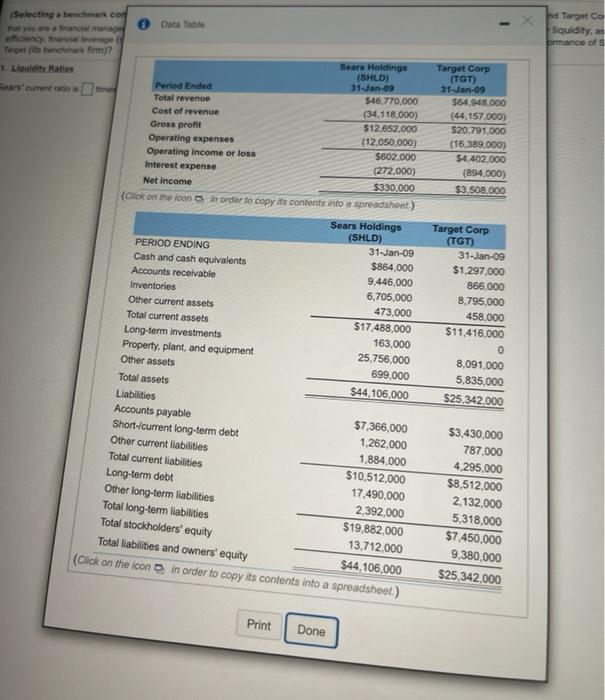
Question Help (Selecting a benchmark company) Here you will find the income statements and balance sheets for Sears Holdings (SHLD) and Target Corp (TGT). Aasume that you are a financial manager at Sears and want to compare your firm's situation with that of Target. Calculate representative ratios for liquidity, asset management officiency, financial leverage (capital structure), and profitability for both Sears and Target. How would you summarize the financial performance of Sears compared to Target its benchmark firm)? 1. Liquidity Ratios Sears' current ratio istimes. (Round to two decimal places.) 6 similar to company) poww in the recommends and balance sheets for Sears Holding (SHED) and wall care you firm's situation with that of Target Calculate representative ratios for liquidity, as mance of Sears Holdings (SHLD) Period Ended 31-Jan-09 Total revenue $46,770,000 Cost of revenue (34,118.000) Gross profit $12,652,000 Operating expenses (12,050,000) Operating income or loss $602,000 Interest expense (272,000) Net Income $330,000 (Click on the con in order to copy its contents into a spreadsheet Target Corp () 31-Jan-09 $64,948.000 (44,157,000) $20.791.000 (16,389,000) $4,402.000 (894,000) $3,508,000 Sears Holdings (SHLD) 31-Jan-09 PERIOD ENDING 5864,000 Cash and cash equivalents 9,446,000 Accounts receivable 6,705,000 Inventories 473,000 Other current assets Total current assets $17.488,000 Long-term investments 163,000 Property, plant, and equipment 25,756,000 Other assets 699,000 Total assets $44.106,000 Liabilities Accounts payable $7,366,000 Short-/current long-term debt 1,262,000 Other current liabilities 1,884,000 Total current liabilities $10,512,000 Long-term debt 17,490,000 Other long-term liabilities Total long-term liabilities 2,392,000 Total stockholders' equity $19,882,000 Total liabilities and owners' equity 13,712,000 (Cook on the icon in order to copy its contents into a spreadsheet) $44,106.000 Target Corp (TGT) 31-Jan-09 $1,297,000 866.000 8,795,000 458.000 $11.416.000 0 8.091.000 5,835,000 $25.342.000 $3,430,000 787,000 4,295,000 $8.512,000 2,132,000 5,318,000 $7.450,000 9,380,000 $25,342.000 Print Done HW Score: 62.33%, 12.47 of 20 pts P4-36 (similar to) Question Help (Selecting a benchmark company) Here you will find the income statements and balance sheets for Sears Holdings (SHLD) and Target Corp (TGT). Assume that you are a financial manager at Sears and want to compare your firm's situation with that of Target. Calculate representative ratios for liquidity asset management efficiency, financial leverage (capital structure and profitability for both Sears and Target. How would you summarize the financial performance of Sears compared to Target its benchmark firm)? 1. Liquidity Ratios Sears current ratio is times. (Round to two decimal places.) hd Target Co liquidity, a prmance of Target Corp (TOT) 31-Jan-09 $64.948.000 (44.157.000) $20.791.000 (16,389,000) $4.402.000 (894,000) $3 508,000 (Selecting a beacon Data Table outral manage ency than everage Tarpet bench firm) Sears Holdings (SHLD) 1. Liquidity Ration 31Jan-09 Period Ended Bears current to me $46,770,000 Total revenue Cost of revenue (34,118,000) Gross profit $12,652,000 Operating expenses (12.050.000) Operating income or loss $602,000 Interest expense (272,000) Net Income $330.000 (Click on the icon in order to copy its contents into a spreadsheet.) Sears Holdings (SHLD) PERIOD ENDING 31-Jan-09 Cash and cash equivalents $864,000 Accounts receivable 9,446,000 Inventories 6,705,000 Other current assets 473.000 Total current assets $17.488,000 Long-term investments 163.000 Property, plant, and equipment 25,756,000 Other assets 699,000 Total assets $44,106.000 Liabilities Accounts payable $7,366,000 Short-current long-term debt 1.262.000 Other current liabilities 1,884,000 Total current liabilities $10,512,000 Long-term debt 17.490,000 Other long-term liabilities 2,392,000 Total long-term liabilities $19,882,000 13,712,000 $44,106,000 Target Corp (TGT) 31-Jan-09 $1.297,000 866.000 8,795,000 458,000 $11.416.000 0 8.091.000 5.835.000 $25.342.000 $3,430,000 787.000 4.295,000 $8,512.000 2,132,000 5,318,000 $7.450,000 9,380,000 $25,342.000 Total stockholders' equity Total liabilities and owners' equity (Click on the icon in order to copy its contents into a spreadsheet.) Print Done
Step by Step Solution
There are 3 Steps involved in it

Get step-by-step solutions from verified subject matter experts