

Question: This is all the information I have regarding the ques (6 points) 1) (2 points) Complete the table by computing the present values (PVs) of
 This is all the information I have regarding the ques
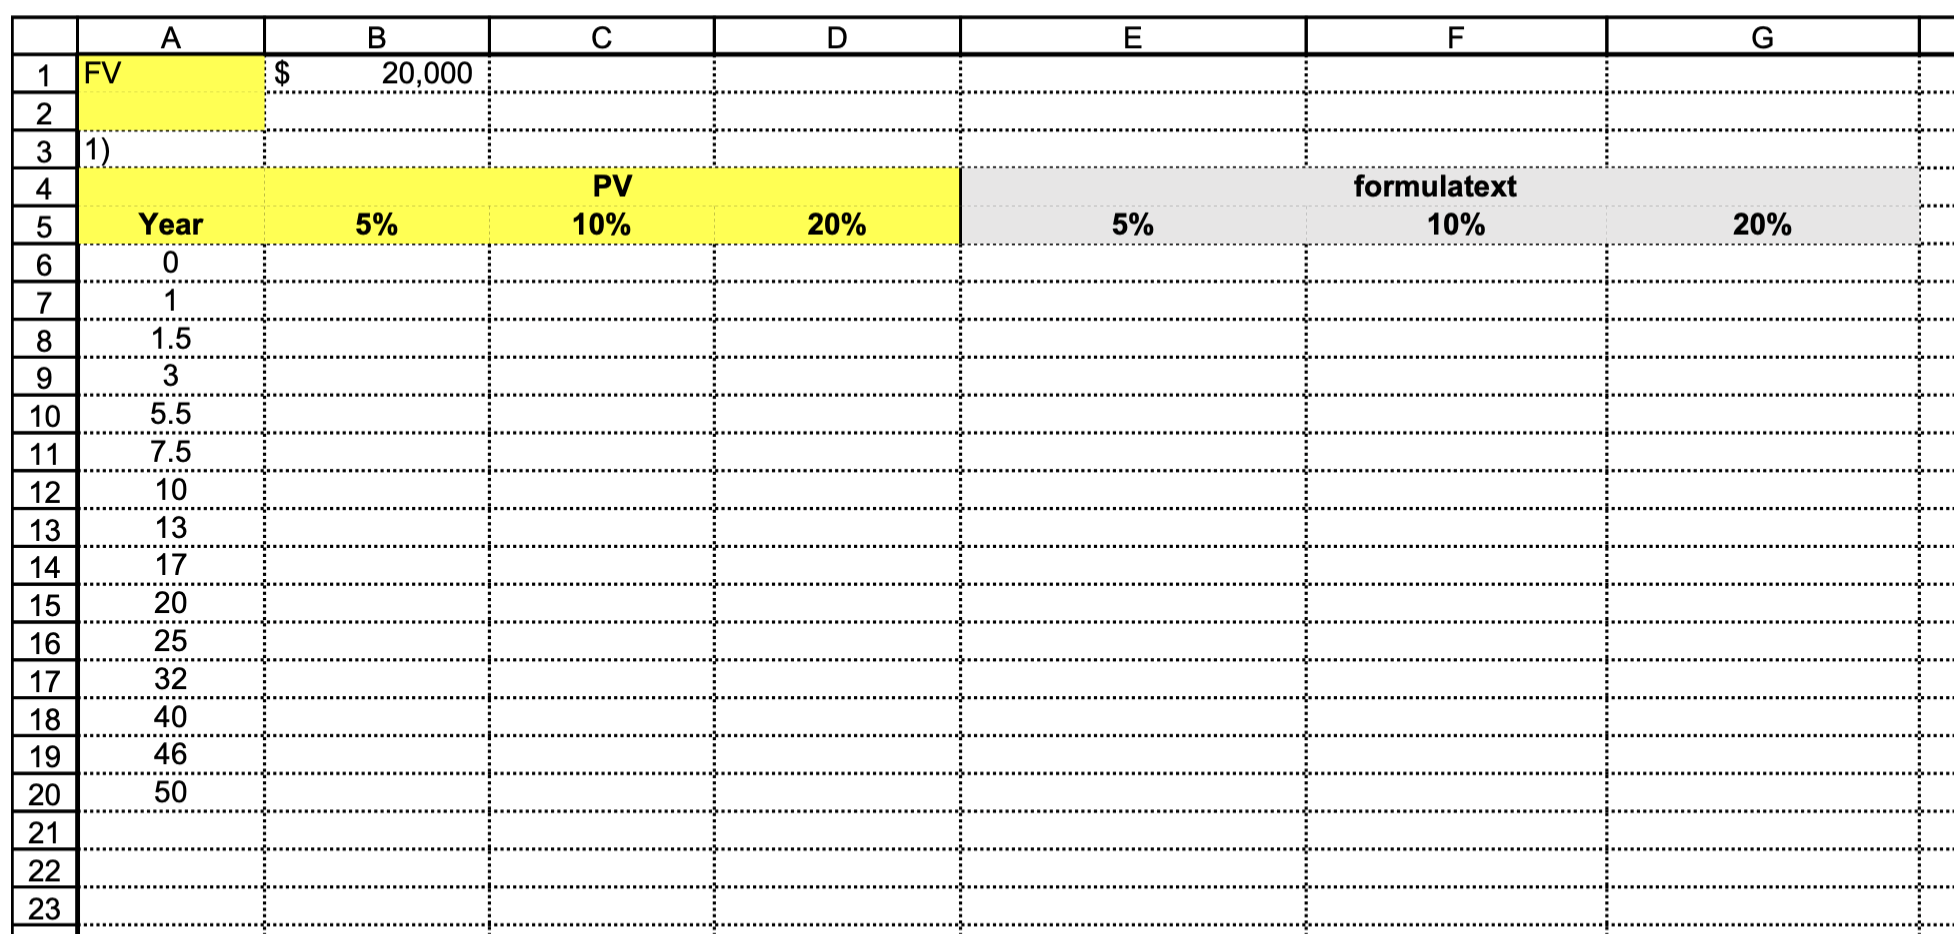
(6 points) 1) (2 points) Complete the table by computing the present values (PVs) of $20,000 received in the given years from 0 to 50 - when the interest rate is 5% - when the interest rate is 10% - when the interest rate is 20% using the PV formula (not the PV Excel function) and absolute or/and relative references (e.g., $B$2,$B2,B$2, or B2) in the most efficient way (show your formulas using the formulatext Excel function). 2) (1.5 points) Draw a scatter plot of the PVs of $20,000 using the table in 1). - X-values: Years - Y-values: PVs (three Y-series: PVs at 5%,PVs at 10% and PVs at 20\%) - Add the chart title, "Scatter chart of PVs of $20,000 at various interest rates." 3) (1.5 points) Draw a line chart of the PVs of $20,000 using the table in 1). - X-values: Years - Y-values: PVs (three Y-series: PVs at 5%, PVs at 10% and PVs at 20\%) - Add the chart title, "Line chart of PVs of $20,000 at various interest rates." 4) (1 point) Choose the correct answer in the following statements: - When the interest rate increases, the PV of $20,000 (increases, decreases). - The PVs of $20,000 are (positively, negatively) associated with the interest rates (r)
Step by Step Solution
There are 3 Steps involved in it

Get step-by-step solutions from verified subject matter experts