Question: This is all the information needed, question a. please! Paste LE Ideas IEEE$ - % 9 Sensitivity BIU-Bv av A- Fonts Conditional Format as Formatting
 This is all the information needed, question a. please!
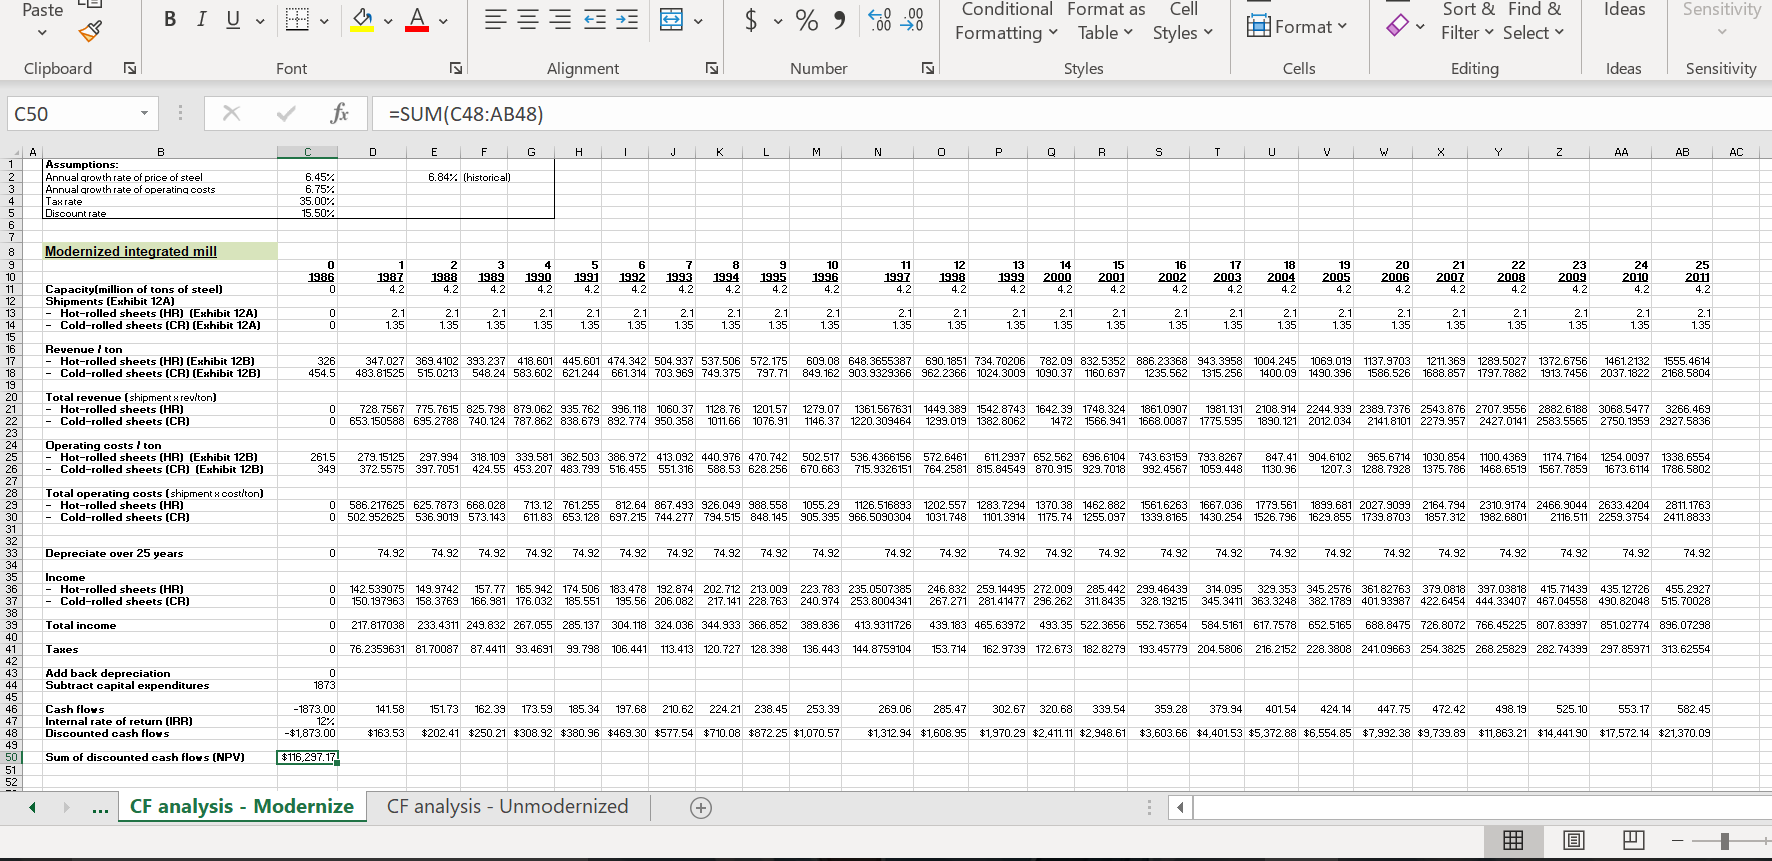
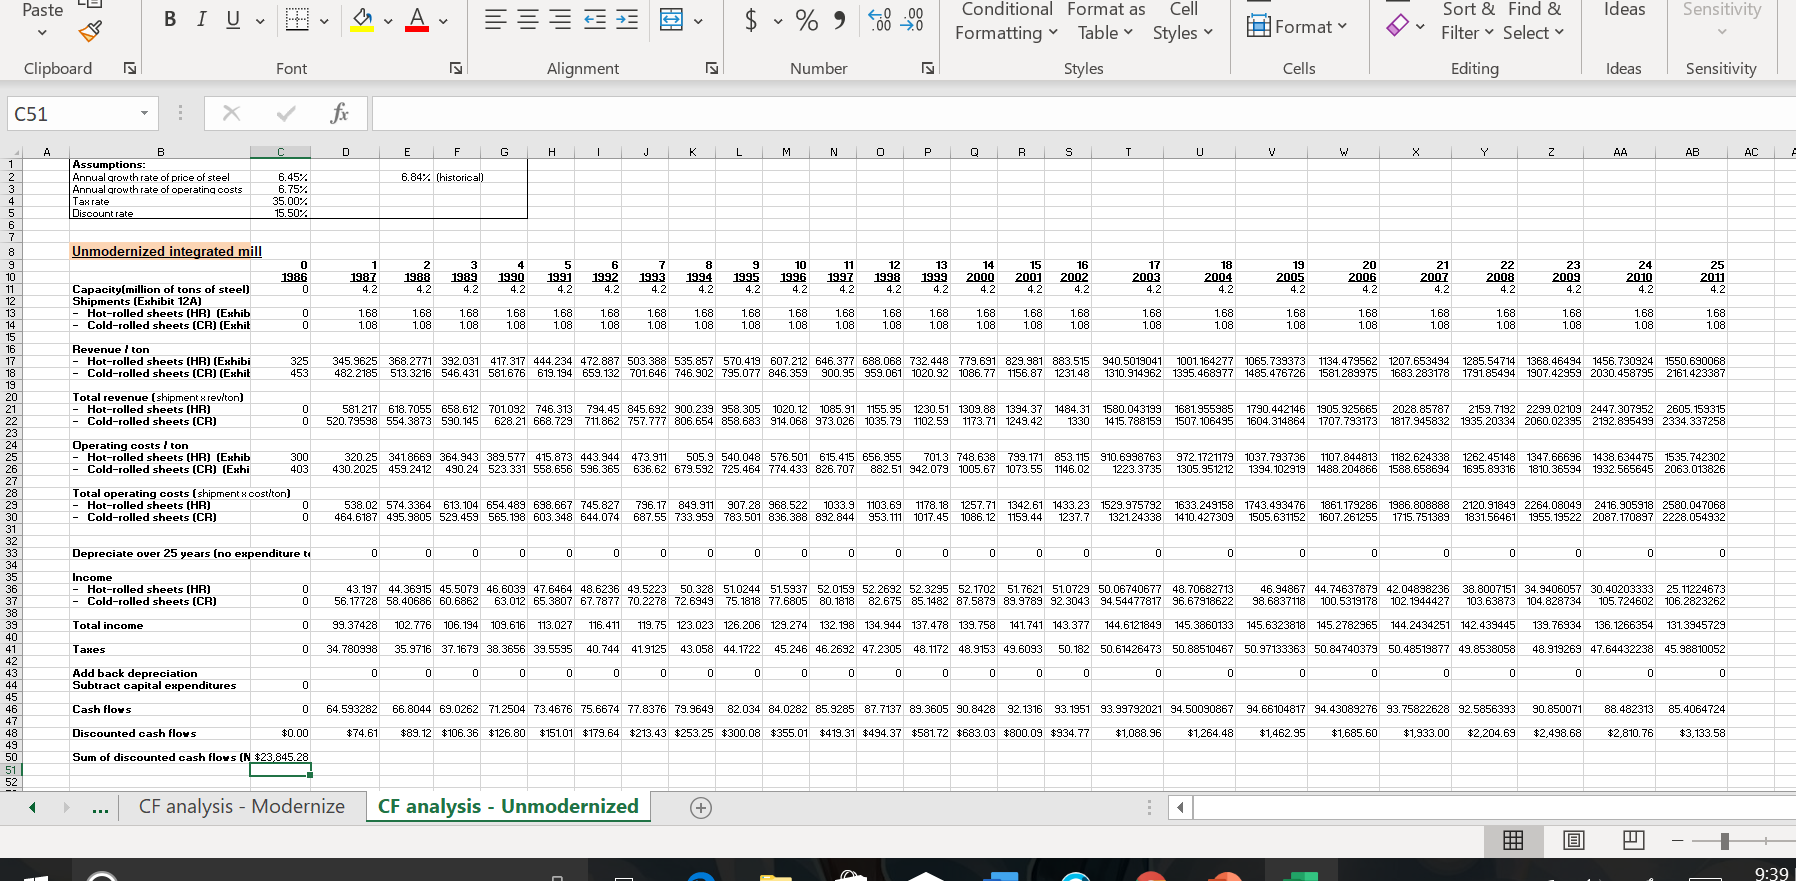
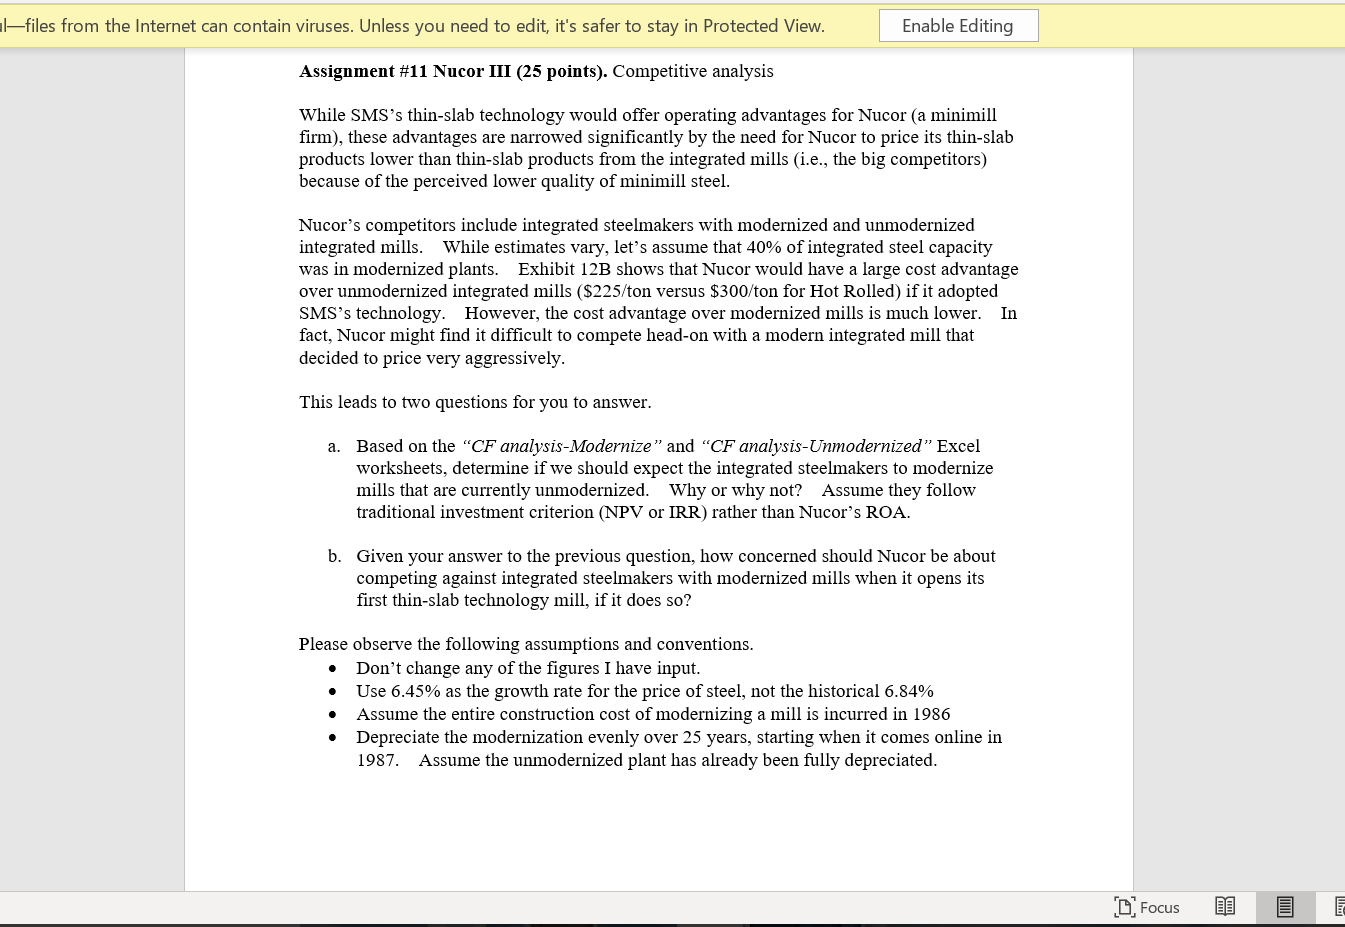
Paste LE Ideas IEEE$ - % 9 Sensitivity BIU-Bv av A- Fonts Conditional Format as Formatting Table Cell Styles Format Sort & Find & Filter Select Clipboard Alignment Number Styles Cells Editing Ideas Sensitivity C50 X fc =SUM(C48:AB48) A B | | | | E | F | G | H | | | | | | | | | | | | | | P | 7 | 8 | 8 | | | | | 4 | 4 | 3 | Y | | 4 | 5 | AC | 1 6.84% (historical) 3 Assumptions: Annual growth rate of price of steel Annual growth rate of operating costs Tax rate Discount rate 6.45% 6.75% 35.007 15 50% Modernized integrated mill ON OPEN 0 14 16 22 24 11 1997 92 18 2004 1986 1987 1989 10 1996 4.2 21 2007 1993 25 2011 1988 4.2 2001 1994 4.2 1995 42 17 2003 4.2 1998 4.2 1999 4.2 20000 4.2 2004 4.2 19 2005 42 20 2006 4.2 2002 4.2 23 2009 4.2 4.2 2008 4.2 4.2 4.2 2010 4.2 4.2 4.2 4.2 4.2 Capacity(million of tons of steel) Shipments (Exhibit 12A) - Hot-rolled sheets (HR) (Exhibit 12A) - Cold-rolled sheets (CR) (Exhibit 12A) - 2.1 135 2.1 2.1 135 2.1 135 2.1 135 135 2.1 135 135 2.1 135 2.1 135 2.1 1.35 2.1 2.1 135 2.1 135 21 1.35 2.1 1.35 2.1 135 - 2.1 1.35 2.1 1.35 2.1 1.35 2.1 1.35 1.35 2.1 1.35 2.1 1.35 1.35 135 135 Revenue / ton - Hot-rolled sheets (HR) (Exhibit 12B) - Cold-rolled sheets (CR) (Exhibit 12B) 326 454.5 347.027 369.4102 393.237 418.601 445.601 474.342 504.937 537.506 572.175 483.81525 515.0213 548.24 583.602 621.244 661.314 703.969 749.375 797.71 609.08 648.3655387 849.162 903.9329366 690.1851 734. 70206 782.09 832.5352 886.23368 943.3958 962.2366 1024.3009 1090.37 1160.697 1235.562 1315.256 1004.245 1069.019 1400.09 1490.396 1137.9703 1586.526 1211.369 1688.857 1289.5027 1797.7882 1372.6756 1913.7456 1461.2132 1555.4614 2037.1822 2168.5804 Total revenue (shipment x reviton) - Hot-rolled sheets (HR) - Cold-rolled sheets (CR) 0 0 7 28.7567 775. 7615 825.798 879.062 935.762 996.118 1060.37 1128.76 653.150588 695.2788 740.124 787.862 838.679 892.774 950.358 101166 1201.57 1076.91 1279.07 1146.37 1361.567631 1449.389 1542.8743 1642.39 1220.309464 1299.019 1382.8062 1472 1748.324 1861.0907 1566.941 1668.0087 1981. 131 2108.914 2244.939 2389.7376 2543.876 2707.9556 2882.6188 1775.595 1890. 121 2012.034 2141.8101 2279.957 2427.0141 2583.5565 3068.5477 3266.469 2750. 1959 2927.5836 Operating costs / ton - Hot-rolled sheets (HR) (Exhibit 12B) - Cold-rolled sheets (CR) (Exhibit 12B) 2015 349 279 15125 372.5575 297 994 318 109 339 581 362 503 386.972 413.092 440,976 470.742 397.7051 424.55 453.207 483.799 516.455 551.316 588.53 628.256 502 517 536,4366156 572,6461 611.2997 652.562 696.6104 743.63159 793.8267 670.663 715.9326151 764.2581 815.84549 870.915 929.7018 992.4567 1059.448 847.41 904.6102965.6714 1030.854 1130.96 1207.3 1288.7928 1375.786 1100.4369 1468.6519 1174.7164 1567.7859 1254.0097 1338.6554 1673.6114 1786.5802 Total operating costs (shipment x cost/ton) - Hot-rolled sheets (HR) - Cold-rolled sheets (CR) 0 0 586.217625 625.7873 668.028 502.952625 536.9019 573.143 713.12 761.255 812.64 867.493 926.049 988.558 611.83 653, 128 697,215 744.277 794.515 848.145 1055.29 1126.516893 905.395 966.5090304 1202.557 1283.7294 1370.38 1462.882 1031.748 1101.3914 1175.74 1255.097 1561.6263 1667.036 1339.8165 1430.254 1779.561 1899.681 2027.9099 2164.794 1526.796 1629.855 1739.8703 1857.312 2310.9174 2466.9044 2633.4204 1982.6801 2116.511 2259.3754 2811. 1763 2411.8833 SAAAAAA88888888898NONONNNNNNOo Depreciate over 25 years 0 74.92 74.92 74.92 74.92 74.92 74.92 74.92 74.92 74.92 7 4.92 74.92 74.92 7 4.92 74.92 74.92 74.92 74.92 74.92 74.92 74.92 74.92 74.92 74.92 74.92 74.92 Income - Hot-rolled sheets (HR) - Cold-rolled sheets (CR) 0 0 142.539075 149.9742 150.197963 158.3769 157.77 165.942 174.506 183.478 192.874 202.712 213.009 223.783 235.0507385 166.981 176.032 185.551 195.56 206.082 217.141 228.763 240.974 253.8004341 246.832 259.14495 272.009 285.442 299.46439 267.271 281.41477 296.262 311.8435 328.19215 314.095329.353 345.2576 361.82763 379.0818 397.03818 415.71439 435. 12726 455.2927 345.3411 363.3248 382.1789 401.93987 422.6454 444.33407 467.04558 490.82048 515.70028 Total income 0 217.817038 233.4311 249.832 267.055 285.137 76.2359631 81.70087 87.4411 93.4691 99.798 304.118 324.036 344.933 366.852 389.836 106.441 113.413 120.727 128.398 136.443 413.9311726 144.8759104 439.183 465.63972 493.35 522.3656 552.73654 584.5161 617.7578 652.5165 688.8475 726.8072 766.45225 807.83997 851.02774 896.07298 153.714 162.9739 172.673 182.8279 193.45779 204.5806 216.2152 228.3808 241.09663 254.3825 268.25829 282.74399 297.85971 313.62554 Taxes 0 Add back depreciation Subtract capital expenditures 1873 Cash floys Internal rate of return (IRR) Discounted cash flows -1873.00 12%. - $1,873.00 $116,297.17 141.58 $163.53 151.73 162.39 173.59 185.34 197.68 210.62 224.21 238.45 253.39 $202.41 $250.21 $308.92 $380.96 $469.30 $577.54 $710.08 $872.25 $1,070.57 269.06 285.47 $1,312.94 $1,608.95 302.67 320.68 339.54 359.28 379.94 401.54 424.14 447.75 472.42 498.19 525.10 5 53.17 582.45 $1,970.29 $2,411.11 $2,948.61 $3,603.66 $4,401.53 $5,372.88 $6,554.85 $7,992.38 $9,739.89 $11,863.21 $14,441.90 $17,572.14 $21,370.09 Sum of discounted cash flows (NPV) ... CF analysis - Modernize CF analysis - Unmodernized @ -- Paste 5 BI U - - - A - B - $ - % 9 Ideas Conditional Format as Formatting Table Cell Styles Sensitivity Sort & Find & Filter Select Format Clipboard Font Alignment Number Styles Cells Editing Ideas Sensitivity C51 C D E F G H I J K L M N O P Q R S T U V + X Y Z AA AB AC A 6.84% (historical) Assumptions: Annual growth rate of price of steel Annual growth rate of operating costs Tax rate Discount rate 6.452 6.75% 35.00% 15.50% =80 OMAWNE Unmodernized integrated mill n 2 10 11 12 13 14 21 25 1986 34 1989 1990 42 42 1991 4.2 1987 1992 42 1988 42 1993 4.2 R 1994 42 1995 1996 4.2 1997 4.2 1998 4.2 17 2003 1999 4.2 18 2004 15 2001 2002 4.2 4.2 19 2005 20 2006 2000 2007 22 2008 4.2 23 2009 4.2 24 2010 4.2 4.2 4.2 4.2 4.2 4.2 4.2 2011 4.2 4.2 Capacity(million of tons of steel) Shipments (Exhibit 12A) - Hot-rolled sheets (HR) (Exhib - Cold-rolled sheets (CR) (Exhit 1.68 1.68 1.08 1.68 1.08 1.68 1.08 168 1.08 168 108 168 108 1.68 108 1.68 1.08 168 1.08 168 1.08 168 1.08 168 .08 1.68 1.08 1.68 1.08 1.68 108 1.68 1.08 1.68 1.08 1.68 108 168 1.08 1.68 108 1.68 1.08 168 1.08 1 1.68 1.08 1.68 1.08 1.08 Revenue / ton - Hot-rolled sheets (HR) (Exhibi - Cold-rolled sheets (CR) (Exhit 325 453 345 9625 388 2771 392 031 417 317 444 234 472.887 503,388 535.857 570.419 607,212 646,377 688,068 732.448 779.691 829.981 883.515 482.2185 513.3216 546.431 581.676 619.194 659.132 701.646 746.902 795.077 846.359 900.95 959.061 1020.92 1086.77 1156.87 1231.48 940.5019041 1001.164277 1065.739373 1310.914962 1395.468977 1485.476726 1134.479562 1207.653494 1581.289975 1683.283178 1285.54714 1368.46494 1456.730924 1550.690068 1791.85494 1907.42959 2030.458795 2161.423387 Total revenue (shipment x reviton) - Hot-rolled sheets (HR) - Cold-rolled sheets (CR) 0 0 581 217 618 7055 658.612 701.092 746.313 794.45 845,692 900.239 958,305 1020.12 1085,91 1155,95 520.79598 554.3873 590.145 628.21 668.729 711.862 757.777 806.654 858.683 914.068 973.026 1035.79 1230.51 1309.88 1394.37 1102.59 1173.71 1249.42 1484.31 1580.043199 1330 1415.788159 1681.955985 1507. 106495 1790.442146 1604.314864 1905.925665 1707.793173 2028.857872159.7192 2299.02109 2447.307952 2605.159315 1817.945832 1935.20334 2060.02395 2192.895499 2334.337258 Operating costs / ton - Hot-rolled sheets (HR) (Exhib - Cold-rolled sheets (CR) (Exhi 3 00 403 320.25 341.8669 364.943 389.577 415.873 443.944 473.911 505.9 540.048 576.501 615.415 656.955 701.3 748.638 799.171 853.115 430.2025 459.2412 490.24 523.331 558.656 596.365 636.62 679.592 725.464 774.433 826.707 882.51 942.079 1005.67 1073.55 1146.02 910.6998763 1223.3735 972. 1721179 1037.793736 1305.951212 1394.102919 1107.844813 1488.204866 1182.624338 1588.658694 1262.45148 1695.89316 1347.66696 1810.36594 1438.634475 1535.742302 1932.565645 2063.013826 Total operating costs (shipment x costiton) - Hot-rolled sheets (HR) - Cold-rolled sheets (CR) 538 02 574 3364 613 104 654 489 698,667 745.827 464.6187 495.9805 529.459 565.198 603.348 644.074 796.17 849.911 907.28 968.522 1033,9 687.55 733.959 783.501 836.388 892.844 1103,69 1178.18 953.111 1017.45 1257.71 1342.61 1433.23 1529.975792 1086.12 1159.44 1237.7 1321.24338 1633.249158 1410.427309 1743.493476 1505.631152 1861.179286 1607.261255 1986.808888 1715.751389 2120.91849 2264.08049 1831.56461 1955. 19522 2416.905918 2580.047068 2087.170897 2228.054932 0 Depreciate over 25 years (no expenditure to 0 0 0 0 0 0 0 0 0 0 0 0 0 0 0 89SABASARABA 88888889888NGMANNN Income - Hot-rolled sheets (HR) - Cold-rolled sheets (CR) 0 0 43.197 44.36915 45.5079 46.6039 47.6464 48.6236 49.5223 50.328 51.0244 51.5937 52.0159 52.2692 52.3295 52. 1702 51.7621 51.0729 50.06740677 48.70682713 46.94867 44.74637879 42.04898236 38.8007151 34.9406057 30.40203333 25.11224673 56.17728 58.40686 60.6862 63.012 65.3807 67.7877 70.2278 72.6949 75.1818 77.6805 80.1818 82.675 85.1482 87.5879 89.9789 92.3043 94.54477817 96.67918622 98.6837118 100.5319178 102. 1944427 103.63873 104.828734 105.724602 106.2823262 9 9.37428 102.776 106.194 109.616 113.027 116.411 119.75 123.023 126.206 129.274 132.198 134.944 137.478 139.758 141.741 143.377 144.6121849 145.3860133 145.6323818 145.2782965 144.2434251 142.439445 139.76934 136. 1266354 131.3945729 34.780998 35.9716 37.1679 38.3656 39.5595 40.744 41.9125 43.058 44.1722 45.246 46.2692 47.2305 48. 1172 48.9153 49.6093 50.182 50.61426473 50.88510467 50.97133363 50.84740379 50.48519877 49.8538058 48.919269 47.64432238 45.98810052 Total income 0 Taxes 0 0 0 0 0 0 Add back depreciation Subtract capital expenditures O Cash floys 0 $0.00 64.593282 $74.61 66.8044 69.0262 71.2504 73.4676 75.6674 77.8376 79.9649 82.034 84.0282 85.9285 87.7137 89.3605 90.8428 92.1316 93. 1951 93.99792021 94.50090867 $89.12 $106.36 $126.80 $151.01 $179.64 $213.43 $253.25 $300.08 $355.01 $419.31 $494.37 3581.72 $683.03 $800.09 $934.77 $1,088.96 $1,264.48 94.66104817 94.43089276 93.75822628 92.5856393 $1,462.95 $1,685.60 $1,933.00 $2,204.69 90.850071 $2,498.68 88.482313 85.4064724 $2,810.76 $3,133.58 Discounted cash flors Sum of discounted cash flovs (N $23,845.28 ... CF analysis - Modernize CF analysis - Unmodernized @ -- 9:39 Ifiles from the Internet can contain viruses. Unless you need to edit, it's safer to stay in Protected View. Enable Editing Assignment #11 Nucor III (25 points). Competitive analysis While SMS's thin-slab technology would offer operating advantages for Nucor (a minimill firm), these advantages are narrowed significantly by the need for Nucor to price its thin-slab products lower than thin-slab products from the integrated mills (i.e., the big competitors) because of the perceived lower quality of minimill steel. Nucor's competitors include integrated steelmakers with modernized and unmodernized integrated mills. While estimates vary, let's assume that 40% of integrated steel capacity was in modernized plants. Exhibit 12B shows that Nucor would have a large cost advantage over unmodernized integrated mills ($225/ton versus $300/ton for Hot Rolled) if it adopted SMS's technology. However, the cost advantage over modernized mills is much lower. In fact, Nucor might find it difficult to compete head-on with a modern integrated mill that decided to price very aggressively. This leads to two questions for you to answer. a. Based on the "CF analysis Modernize" and "CF analysis-Unmodernized" Excel worksheets, determine if we should expect the integrated steelmakers to modernize mills that are currently unmodernized. Why or why not? Assume they follow traditional investment criterion (NPV or IRR) rather than Nucor's ROA. b. Given your answer to the previous question, how concerned should Nucor be about competing against integrated steelmakers with modernized mills when it opens its first thin-slab technology mill, if it does so? Please observe the following assumptions and conventions. Don't change any of the figures I have input. Use 6.45% as the growth rate for the price of steel, not the historical 6.84% Assume the entire construction cost of modernizing a mill is incurred in 1986 Depreciate the modernization evenly over 25 years, starting when it comes online in 1987. Assume the unmodernized plant has already been fully depreciated. DJ Focus , Paste LE Ideas IEEE$ - % 9 Sensitivity BIU-Bv av A- Fonts Conditional Format as Formatting Table Cell Styles Format Sort & Find & Filter Select Clipboard Alignment Number Styles Cells Editing Ideas Sensitivity C50 X fc =SUM(C48:AB48) A B | | | | E | F | G | H | | | | | | | | | | | | | | P | 7 | 8 | 8 | | | | | 4 | 4 | 3 | Y | | 4 | 5 | AC | 1 6.84% (historical) 3 Assumptions: Annual growth rate of price of steel Annual growth rate of operating costs Tax rate Discount rate 6.45% 6.75% 35.007 15 50% Modernized integrated mill ON OPEN 0 14 16 22 24 11 1997 92 18 2004 1986 1987 1989 10 1996 4.2 21 2007 1993 25 2011 1988 4.2 2001 1994 4.2 1995 42 17 2003 4.2 1998 4.2 1999 4.2 20000 4.2 2004 4.2 19 2005 42 20 2006 4.2 2002 4.2 23 2009 4.2 4.2 2008 4.2 4.2 4.2 2010 4.2 4.2 4.2 4.2 4.2 Capacity(million of tons of steel) Shipments (Exhibit 12A) - Hot-rolled sheets (HR) (Exhibit 12A) - Cold-rolled sheets (CR) (Exhibit 12A) - 2.1 135 2.1 2.1 135 2.1 135 2.1 135 135 2.1 135 135 2.1 135 2.1 135 2.1 1.35 2.1 2.1 135 2.1 135 21 1.35 2.1 1.35 2.1 135 - 2.1 1.35 2.1 1.35 2.1 1.35 2.1 1.35 1.35 2.1 1.35 2.1 1.35 1.35 135 135 Revenue / ton - Hot-rolled sheets (HR) (Exhibit 12B) - Cold-rolled sheets (CR) (Exhibit 12B) 326 454.5 347.027 369.4102 393.237 418.601 445.601 474.342 504.937 537.506 572.175 483.81525 515.0213 548.24 583.602 621.244 661.314 703.969 749.375 797.71 609.08 648.3655387 849.162 903.9329366 690.1851 734. 70206 782.09 832.5352 886.23368 943.3958 962.2366 1024.3009 1090.37 1160.697 1235.562 1315.256 1004.245 1069.019 1400.09 1490.396 1137.9703 1586.526 1211.369 1688.857 1289.5027 1797.7882 1372.6756 1913.7456 1461.2132 1555.4614 2037.1822 2168.5804 Total revenue (shipment x reviton) - Hot-rolled sheets (HR) - Cold-rolled sheets (CR) 0 0 7 28.7567 775. 7615 825.798 879.062 935.762 996.118 1060.37 1128.76 653.150588 695.2788 740.124 787.862 838.679 892.774 950.358 101166 1201.57 1076.91 1279.07 1146.37 1361.567631 1449.389 1542.8743 1642.39 1220.309464 1299.019 1382.8062 1472 1748.324 1861.0907 1566.941 1668.0087 1981. 131 2108.914 2244.939 2389.7376 2543.876 2707.9556 2882.6188 1775.595 1890. 121 2012.034 2141.8101 2279.957 2427.0141 2583.5565 3068.5477 3266.469 2750. 1959 2927.5836 Operating costs / ton - Hot-rolled sheets (HR) (Exhibit 12B) - Cold-rolled sheets (CR) (Exhibit 12B) 2015 349 279 15125 372.5575 297 994 318 109 339 581 362 503 386.972 413.092 440,976 470.742 397.7051 424.55 453.207 483.799 516.455 551.316 588.53 628.256 502 517 536,4366156 572,6461 611.2997 652.562 696.6104 743.63159 793.8267 670.663 715.9326151 764.2581 815.84549 870.915 929.7018 992.4567 1059.448 847.41 904.6102965.6714 1030.854 1130.96 1207.3 1288.7928 1375.786 1100.4369 1468.6519 1174.7164 1567.7859 1254.0097 1338.6554 1673.6114 1786.5802 Total operating costs (shipment x cost/ton) - Hot-rolled sheets (HR) - Cold-rolled sheets (CR) 0 0 586.217625 625.7873 668.028 502.952625 536.9019 573.143 713.12 761.255 812.64 867.493 926.049 988.558 611.83 653, 128 697,215 744.277 794.515 848.145 1055.29 1126.516893 905.395 966.5090304 1202.557 1283.7294 1370.38 1462.882 1031.748 1101.3914 1175.74 1255.097 1561.6263 1667.036 1339.8165 1430.254 1779.561 1899.681 2027.9099 2164.794 1526.796 1629.855 1739.8703 1857.312 2310.9174 2466.9044 2633.4204 1982.6801 2116.511 2259.3754 2811. 1763 2411.8833 SAAAAAA88888888898NONONNNNNNOo Depreciate over 25 years 0 74.92 74.92 74.92 74.92 74.92 74.92 74.92 74.92 74.92 7 4.92 74.92 74.92 7 4.92 74.92 74.92 74.92 74.92 74.92 74.92 74.92 74.92 74.92 74.92 74.92 74.92 Income - Hot-rolled sheets (HR) - Cold-rolled sheets (CR) 0 0 142.539075 149.9742 150.197963 158.3769 157.77 165.942 174.506 183.478 192.874 202.712 213.009 223.783 235.0507385 166.981 176.032 185.551 195.56 206.082 217.141 228.763 240.974 253.8004341 246.832 259.14495 272.009 285.442 299.46439 267.271 281.41477 296.262 311.8435 328.19215 314.095329.353 345.2576 361.82763 379.0818 397.03818 415.71439 435. 12726 455.2927 345.3411 363.3248 382.1789 401.93987 422.6454 444.33407 467.04558 490.82048 515.70028 Total income 0 217.817038 233.4311 249.832 267.055 285.137 76.2359631 81.70087 87.4411 93.4691 99.798 304.118 324.036 344.933 366.852 389.836 106.441 113.413 120.727 128.398 136.443 413.9311726 144.8759104 439.183 465.63972 493.35 522.3656 552.73654 584.5161 617.7578 652.5165 688.8475 726.8072 766.45225 807.83997 851.02774 896.07298 153.714 162.9739 172.673 182.8279 193.45779 204.5806 216.2152 228.3808 241.09663 254.3825 268.25829 282.74399 297.85971 313.62554 Taxes 0 Add back depreciation Subtract capital expenditures 1873 Cash floys Internal rate of return (IRR) Discounted cash flows -1873.00 12%. - $1,873.00 $116,297.17 141.58 $163.53 151.73 162.39 173.59 185.34 197.68 210.62 224.21 238.45 253.39 $202.41 $250.21 $308.92 $380.96 $469.30 $577.54 $710.08 $872.25 $1,070.57 269.06 285.47 $1,312.94 $1,608.95 302.67 320.68 339.54 359.28 379.94 401.54 424.14 447.75 472.42 498.19 525.10 5 53.17 582.45 $1,970.29 $2,411.11 $2,948.61 $3,603.66 $4,401.53 $5,372.88 $6,554.85 $7,992.38 $9,739.89 $11,863.21 $14,441.90 $17,572.14 $21,370.09 Sum of discounted cash flows (NPV) ... CF analysis - Modernize CF analysis - Unmodernized @ -- Paste 5 BI U - - - A - B - $ - % 9 Ideas Conditional Format as Formatting Table Cell Styles Sensitivity Sort & Find & Filter Select Format Clipboard Font Alignment Number Styles Cells Editing Ideas Sensitivity C51 C D E F G H I J K L M N O P Q R S T U V + X Y Z AA AB AC A 6.84% (historical) Assumptions: Annual growth rate of price of steel Annual growth rate of operating costs Tax rate Discount rate 6.452 6.75% 35.00% 15.50% =80 OMAWNE Unmodernized integrated mill n 2 10 11 12 13 14 21 25 1986 34 1989 1990 42 42 1991 4.2 1987 1992 42 1988 42 1993 4.2 R 1994 42 1995 1996 4.2 1997 4.2 1998 4.2 17 2003 1999 4.2 18 2004 15 2001 2002 4.2 4.2 19 2005 20 2006 2000 2007 22 2008 4.2 23 2009 4.2 24 2010 4.2 4.2 4.2 4.2 4.2 4.2 4.2 2011 4.2 4.2 Capacity(million of tons of steel) Shipments (Exhibit 12A) - Hot-rolled sheets (HR) (Exhib - Cold-rolled sheets (CR) (Exhit 1.68 1.68 1.08 1.68 1.08 1.68 1.08 168 1.08 168 108 168 108 1.68 108 1.68 1.08 168 1.08 168 1.08 168 1.08 168 .08 1.68 1.08 1.68 1.08 1.68 108 1.68 1.08 1.68 1.08 1.68 108 168 1.08 1.68 108 1.68 1.08 168 1.08 1 1.68 1.08 1.68 1.08 1.08 Revenue / ton - Hot-rolled sheets (HR) (Exhibi - Cold-rolled sheets (CR) (Exhit 325 453 345 9625 388 2771 392 031 417 317 444 234 472.887 503,388 535.857 570.419 607,212 646,377 688,068 732.448 779.691 829.981 883.515 482.2185 513.3216 546.431 581.676 619.194 659.132 701.646 746.902 795.077 846.359 900.95 959.061 1020.92 1086.77 1156.87 1231.48 940.5019041 1001.164277 1065.739373 1310.914962 1395.468977 1485.476726 1134.479562 1207.653494 1581.289975 1683.283178 1285.54714 1368.46494 1456.730924 1550.690068 1791.85494 1907.42959 2030.458795 2161.423387 Total revenue (shipment x reviton) - Hot-rolled sheets (HR) - Cold-rolled sheets (CR) 0 0 581 217 618 7055 658.612 701.092 746.313 794.45 845,692 900.239 958,305 1020.12 1085,91 1155,95 520.79598 554.3873 590.145 628.21 668.729 711.862 757.777 806.654 858.683 914.068 973.026 1035.79 1230.51 1309.88 1394.37 1102.59 1173.71 1249.42 1484.31 1580.043199 1330 1415.788159 1681.955985 1507. 106495 1790.442146 1604.314864 1905.925665 1707.793173 2028.857872159.7192 2299.02109 2447.307952 2605.159315 1817.945832 1935.20334 2060.02395 2192.895499 2334.337258 Operating costs / ton - Hot-rolled sheets (HR) (Exhib - Cold-rolled sheets (CR) (Exhi 3 00 403 320.25 341.8669 364.943 389.577 415.873 443.944 473.911 505.9 540.048 576.501 615.415 656.955 701.3 748.638 799.171 853.115 430.2025 459.2412 490.24 523.331 558.656 596.365 636.62 679.592 725.464 774.433 826.707 882.51 942.079 1005.67 1073.55 1146.02 910.6998763 1223.3735 972. 1721179 1037.793736 1305.951212 1394.102919 1107.844813 1488.204866 1182.624338 1588.658694 1262.45148 1695.89316 1347.66696 1810.36594 1438.634475 1535.742302 1932.565645 2063.013826 Total operating costs (shipment x costiton) - Hot-rolled sheets (HR) - Cold-rolled sheets (CR) 538 02 574 3364 613 104 654 489 698,667 745.827 464.6187 495.9805 529.459 565.198 603.348 644.074 796.17 849.911 907.28 968.522 1033,9 687.55 733.959 783.501 836.388 892.844 1103,69 1178.18 953.111 1017.45 1257.71 1342.61 1433.23 1529.975792 1086.12 1159.44 1237.7 1321.24338 1633.249158 1410.427309 1743.493476 1505.631152 1861.179286 1607.261255 1986.808888 1715.751389 2120.91849 2264.08049 1831.56461 1955. 19522 2416.905918 2580.047068 2087.170897 2228.054932 0 Depreciate over 25 years (no expenditure to 0 0 0 0 0 0 0 0 0 0 0 0 0 0 0 89SABASARABA 88888889888NGMANNN Income - Hot-rolled sheets (HR) - Cold-rolled sheets (CR) 0 0 43.197 44.36915 45.5079 46.6039 47.6464 48.6236 49.5223 50.328 51.0244 51.5937 52.0159 52.2692 52.3295 52. 1702 51.7621 51.0729 50.06740677 48.70682713 46.94867 44.74637879 42.04898236 38.8007151 34.9406057 30.40203333 25.11224673 56.17728 58.40686 60.6862 63.012 65.3807 67.7877 70.2278 72.6949 75.1818 77.6805 80.1818 82.675 85.1482 87.5879 89.9789 92.3043 94.54477817 96.67918622 98.6837118 100.5319178 102. 1944427 103.63873 104.828734 105.724602 106.2823262 9 9.37428 102.776 106.194 109.616 113.027 116.411 119.75 123.023 126.206 129.274 132.198 134.944 137.478 139.758 141.741 143.377 144.6121849 145.3860133 145.6323818 145.2782965 144.2434251 142.439445 139.76934 136. 1266354 131.3945729 34.780998 35.9716 37.1679 38.3656 39.5595 40.744 41.9125 43.058 44.1722 45.246 46.2692 47.2305 48. 1172 48.9153 49.6093 50.182 50.61426473 50.88510467 50.97133363 50.84740379 50.48519877 49.8538058 48.919269 47.64432238 45.98810052 Total income 0 Taxes 0 0 0 0 0 0 Add back depreciation Subtract capital expenditures O Cash floys 0 $0.00 64.593282 $74.61 66.8044 69.0262 71.2504 73.4676 75.6674 77.8376 79.9649 82.034 84.0282 85.9285 87.7137 89.3605 90.8428 92.1316 93. 1951 93.99792021 94.50090867 $89.12 $106.36 $126.80 $151.01 $179.64 $213.43 $253.25 $300.08 $355.01 $419.31 $494.37 3581.72 $683.03 $800.09 $934.77 $1,088.96 $1,264.48 94.66104817 94.43089276 93.75822628 92.5856393 $1,462.95 $1,685.60 $1,933.00 $2,204.69 90.850071 $2,498.68 88.482313 85.4064724 $2,810.76 $3,133.58 Discounted cash flors Sum of discounted cash flovs (N $23,845.28 ... CF analysis - Modernize CF analysis - Unmodernized @ -- 9:39 Ifiles from the Internet can contain viruses. Unless you need to edit, it's safer to stay in Protected View. Enable Editing Assignment #11 Nucor III (25 points). Competitive analysis While SMS's thin-slab technology would offer operating advantages for Nucor (a minimill firm), these advantages are narrowed significantly by the need for Nucor to price its thin-slab products lower than thin-slab products from the integrated mills (i.e., the big competitors) because of the perceived lower quality of minimill steel. Nucor's competitors include integrated steelmakers with modernized and unmodernized integrated mills. While estimates vary, let's assume that 40% of integrated steel capacity was in modernized plants. Exhibit 12B shows that Nucor would have a large cost advantage over unmodernized integrated mills ($225/ton versus $300/ton for Hot Rolled) if it adopted SMS's technology. However, the cost advantage over modernized mills is much lower. In fact, Nucor might find it difficult to compete head-on with a modern integrated mill that decided to price very aggressively. This leads to two questions for you to answer. a. Based on the "CF analysis Modernize" and "CF analysis-Unmodernized" Excel worksheets, determine if we should expect the integrated steelmakers to modernize mills that are currently unmodernized. Why or why not? Assume they follow traditional investment criterion (NPV or IRR) rather than Nucor's ROA. b. Given your answer to the previous question, how concerned should Nucor be about competing against integrated steelmakers with modernized mills when it opens its first thin-slab technology mill, if it does so? Please observe the following assumptions and conventions. Don't change any of the figures I have input. Use 6.45% as the growth rate for the price of steel, not the historical 6.84% Assume the entire construction cost of modernizing a mill is incurred in 1986 Depreciate the modernization evenly over 25 years, starting when it comes online in 1987. Assume the unmodernized plant has already been fully depreciated. DJ Focus


