

Question: This is an example of a real Tafel plot. The negative deviations from linearity at very large overpotentials come from limitations imposed by mass transfer.
This is an example of a real Tafel plot. The negative deviations from linearity at very large overpotentials come from limitations imposed by mass transfer. The region of very low overpotentials shows sharp falloffs for the reasons outlined just above.
k0 is the standard heterogenous rate constant [in cm/s]
j0 is the exchange current density [in A/cm2]
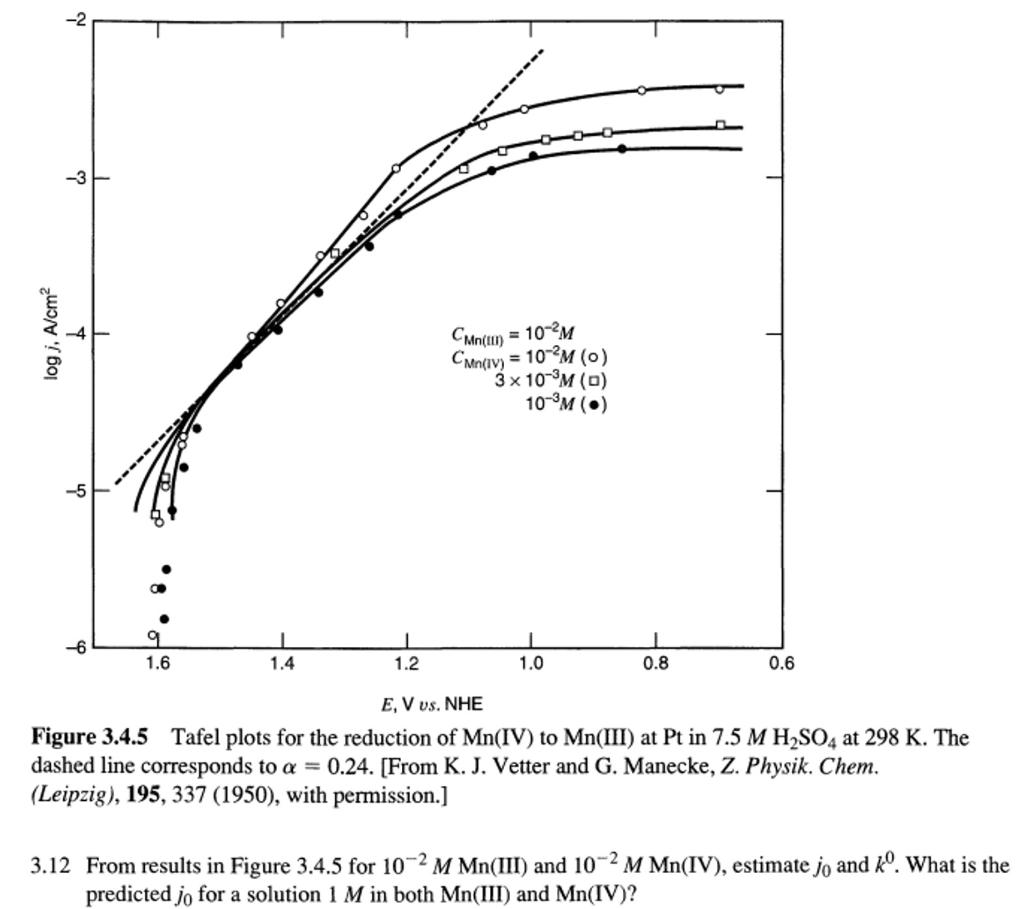
rigure 5.4.5 latel plots tor the reduction of Mn(IV) to Mn(111) at Pt in /.5MH2SU4 at 298K. The dashed line corresponds to =0.24. [From K. J. Vetter and G. Manecke, Z. Physik. Chem. (Leipzig), 195, 337 (1950), with permission.] 3.12 From results in Figure 3.4.5 for 102MMn (III) and 102MMn (IV), estimate j0 and k0. What is the predicted j0 for a solution 1M in both Mn(III) and Mn(IV)
Step by Step Solution
There are 3 Steps involved in it

Get step-by-step solutions from verified subject matter experts