

Question: This is an image of the assignment I need help with: COMPETITIVE DATA & ANALYSIS A. Sales in ABC's served market (150 locations): i) 2005

This is an image of the assignment I need help with:
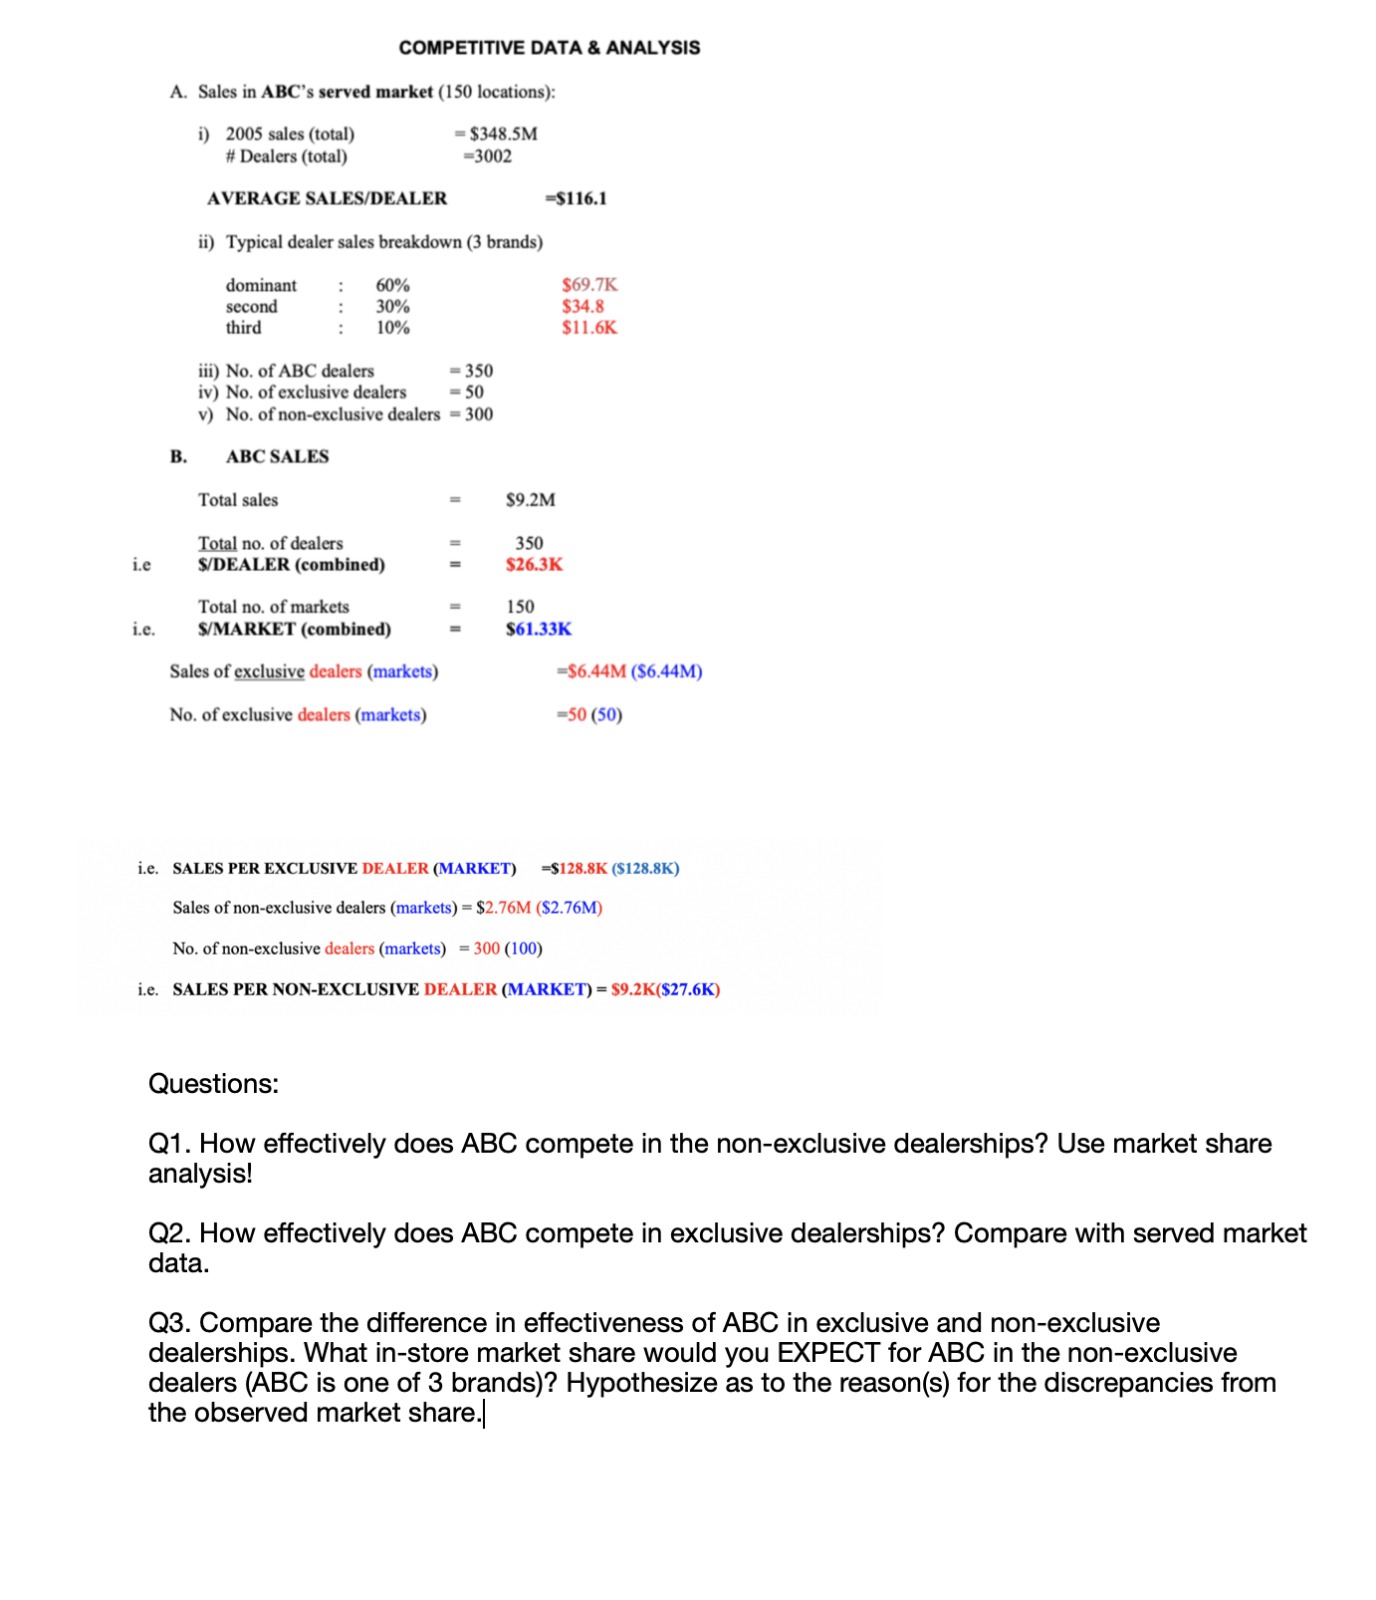
COMPETITIVE DATA & ANALYSIS A. Sales in ABC's served market (150 locations): i) 2005 sales (total) = $348.5M # Dealers (total) -3002 AVERAGE SALES/DEALER =$116.1 ii) Typical dealer sales breakdown (3 brands) dominant . .. .. 60% $69.7K second 30% $34.8 hird 10% $11.6K iii) No. of ABC dealers - 350 iv) No. of exclusive dealers = 50 v) No. of non-exclusive dealers = 300 ABC SALES Total sales $9.2M Total no. of dealers 350 S/DEALER (combined) $26.3K Total no. of markets 150 i.e S/MARKET (combined) $61.33K Sales of exclusive dealers (markets) =$6.44M ($6.44M) No. of exclusive dealers (markets) -50 (50) i.e. SALES PER EXCLUSIVE DEALER (MARKET) =$128.8K ($128.8K) Sales of non-exclusive dealers (markets) = $2.76M ($2.76M) No. of non-exclusive dealers (markets) = 300 (100) i.e. SALES PER NON-EXCLUSIVE DEALER (MARKET) = $9.2K($27.6K) Questions: Q1. How effectively does ABC compete in the non-exclusive dealerships? Use market share analysis! Q2. How effectively does ABC compete in exclusive dealerships? Compare with served market data. Q3. Compare the difference in effectiveness of ABC in exclusive and non-exclusive dealerships. What in-store market share would you EXPECT for ABC in the non-exclusive dealers (ABC is one of 3 brands)? Hypothesize as to the reason(s) for the discrepancies from the observed market share.|
Step by Step Solution
There are 3 Steps involved in it

Get step-by-step solutions from verified subject matter experts